
Figure 1.
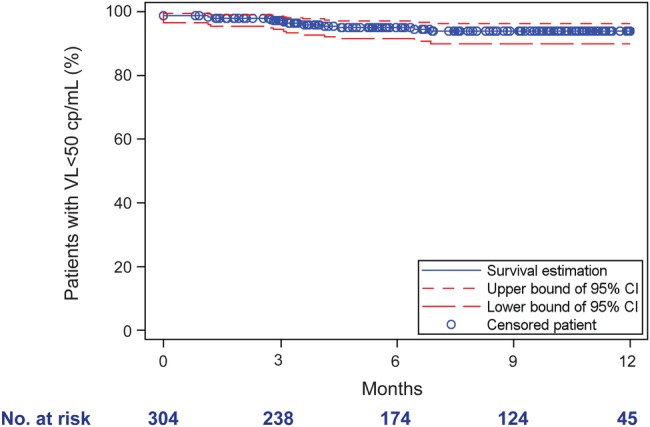
Kaplan–Meier analysis of cumulative rates of patient with a viral load (VL) <50 copies/mL after 12-month follow-up. Kaplan–Meier survival analysis showing the proportion of patients remaining virologically suppressed. The x-axis shows days since initiation of single-tablet regimen (STR): M3 (92 days), M6 (183 days), M9 (274 days), and M12 (365 days). The y-axis shows proportions of participants remaining <50 copies/mL. Numbers at risk and contributing to the analysis at each timepoint are shown below the x-axis.