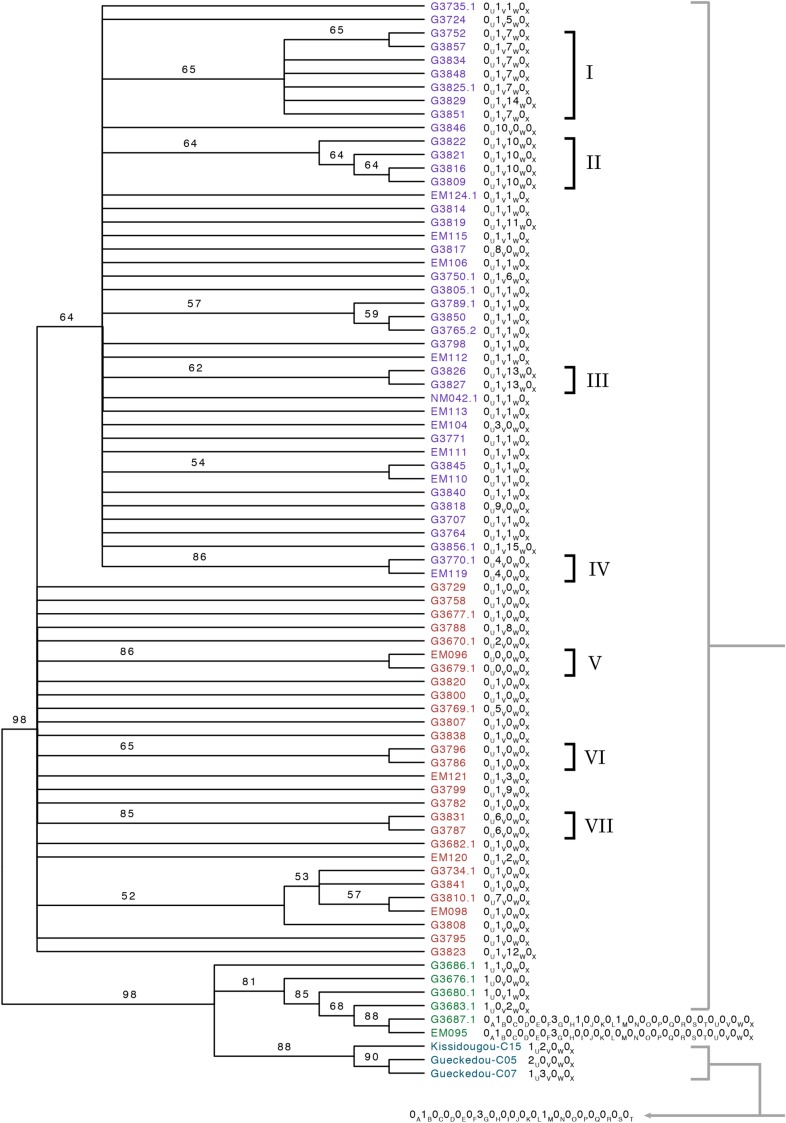
Figure 3.
Maximum likelihood phylogeny of ebolavirus genomes from the 2014 Ebola virus disease outbreak in West Africa with identifying Life Identification Number (LIN) positions mapped to taxa. Branch labels are nonparametric bootstrap support values as a percentage of 1200 bootstrap replicates. Branches with less than 50% bootstrap support were collapsed into polytomies. Branches are not to scale. All 2014 ebolavirus genomes shared all LIN positions up to position T (indicated in gray below the tree and by gray brackets) except for isolates G3687.1 and EM095, which were different at positions I and M, respectively. Group SL1 isolates are green, SL2 isolates are red, SL3 isolates are purple, and Guinean isolates are blue. All isolates are of variant “Makona” [15] and labels are based on isolate names in reference [9]. The labels “Kissidougou” and “Gueckedou” are the location of isolation in Guinea based on reference [8].

