
Figure 3.
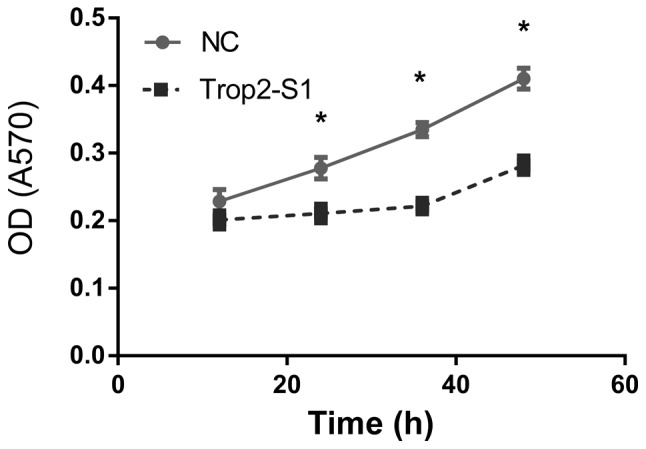
Downregulation of Trop2 in Hep2 cells inhibits viability. OD was measured at 12, 24, 36 and 48 h following transfection of Hep2 cells with control (NC) or Trop2 (Trop2-S1) using the MTT assay. At 24 h, OD was 0.21±0.02 and 0.23±0.03 in Trop2 suppressed cells and NC, respectively; OD reduced by 8.6%. At 36 h, OD was 0.24±0.03 and 0.33±0.02 in Trop2 suppressed cells and NC, respectively; OD reduced by 27.2%. At 48 h, OD was 0.29±0.04 and 0.41±0.03 in Trop2 suppressed cells and NC, respectively; OD reduced by 29.2%. *P<0.05. OD, optical density; NC, negative control.