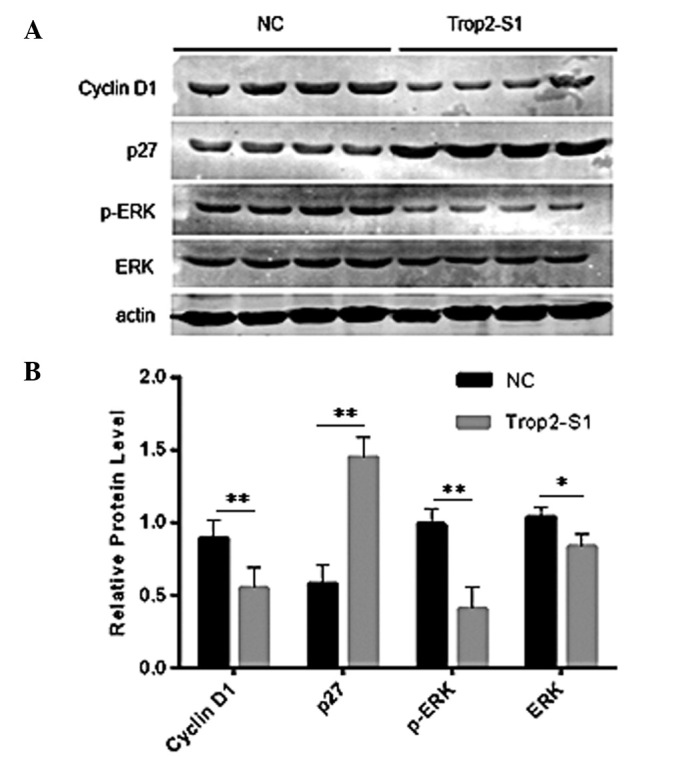
Figure 6.

Protein expression levels of cyclin D1, p27, p-ERK and ERK following Trop2 knockdown for 48 h in Hep2 cells. (A) Western blot analysis of cyclin D1, p27, p-ERK and ERK, NC and Trop2-S1 expression levels. (B) Relative target protein expression (gray scale value of target protein/gray scale value of β-actin) was determined using Quantity One 1-D v4.62 software. *P<0.05, **P<0.001. ERK, extracellular signal-regulated kinase; NC, negative control.
