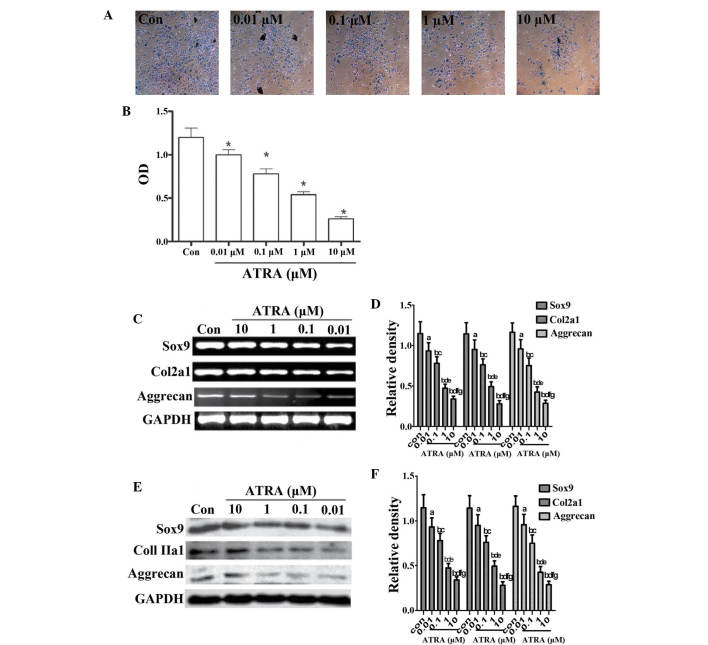
Figure 1.
ATRA suppresses chondrogenesis. (A) Alcian blue staining of rEHBMCs grown in micromass cultures in the presence of varying concentrations of ATRA on day two of culture (magnification, ×100). (B) Quantification of chondrogenesis was determined by measuring the absorbance of bound Alcian blue at 600 nm. *P<0.05, compared with control cells. (C) and (E) Changes in the levels of Sox9, aggrecan and Col2a1 in control and ATRA-treated cultures were determined by reverse transcription polymerase chain reaction and western blotting on day two of culture. Results shown are representative of at least three independent experiments. GAPDH was used as a loading control. (D) and (F) Densitometric quantification of Sox9, Col2a1 and aggrecan was performed. (D) aP>0.05; bP<0.05, versus control group; cP>0.05; dP<0.05, versus 0.01 μM ATRA group; eP>0.05; fP<0.05, versus 0.1 μM ATRA group; gP>0.05, versus 1 μM ATRA group. (F) aP>0.05; bP<0.05 versus control group; cP>0.05; dP<0.05, versus 0.01 μM ATRA group; eP>0.05; fP<0.05, versus 0.1 μM ATRA group; gP>0.05, versus 1 μM ATRA group. ATRA, all-trans-retinoic acid; rEHBMCs, rat embryo hindlimb bud mesenchymal cells; Col2a1, collagen, type II, α 1; OD, optical density.

