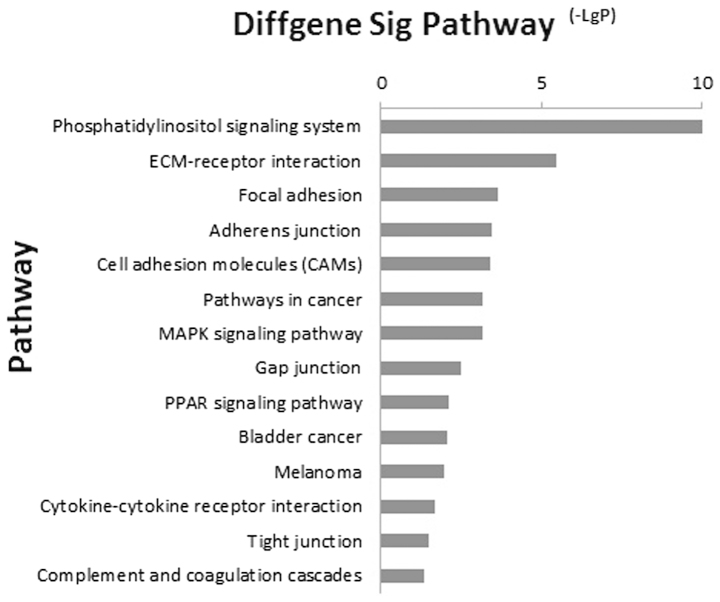
Figure 2.
Histogram of signaling pathways, which different significantly between the ESCC and normal samples. X-axis, negative logarithm of the P-value (-LgP); Y-axis, pathway. The higher the -LgP, the lower the P-value. ECM, extracellular matrix; MAPK, mitogen-activated protein kinase; PPAR, peroxisome proliferator-activated receptor.

