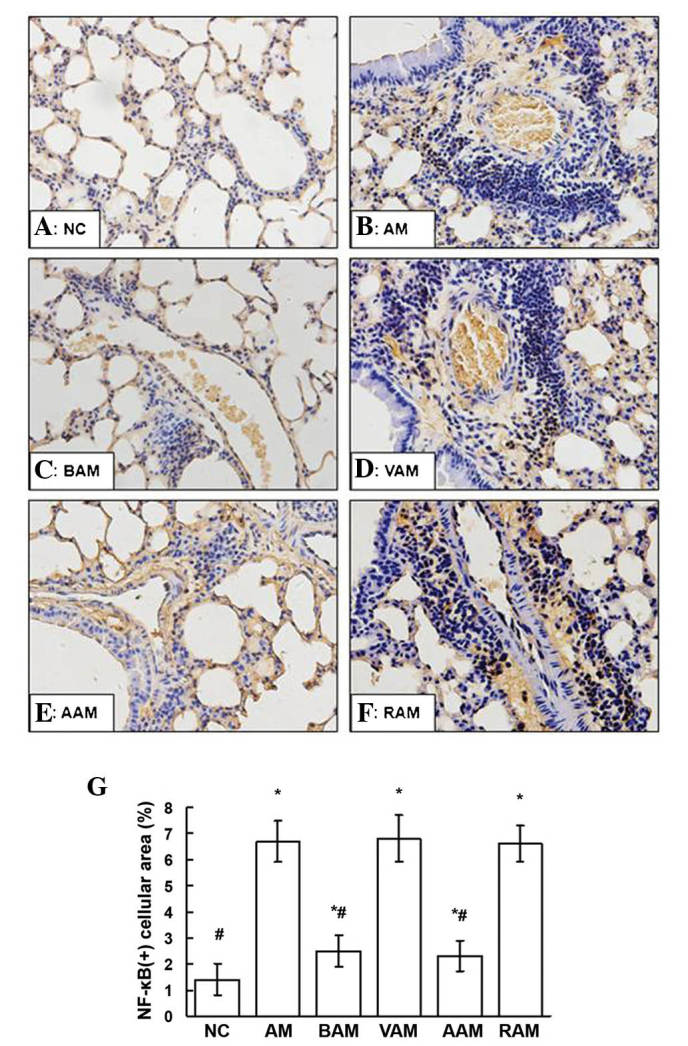
Figure 5.

(A–F) Expression of NF-κB p65 in lung tissue assessed using immunohistochemistry in the mice in each group (deep brown cellular area indicates positive staining; magnification, x200). (G) The mean ratio of the NF-κB-positive cellular area in five fields of view per section of each mouse was assessed by JD-801 computer-aided image analyzer under high-power magnification (x200). Values are expressed as the mean ± standard deviation of five mice in each group. *P<0.05, as compared with the NC group. #P<0.05, as compared with the AM group. NC, normal controls; AM, ovalbumin immunization-induced asthmatic mice; BAM, BML-111-treated AM; VAM, vehicle of BML-111-treated AM; AAM, anti-IL-1β antibody-treated AM; RAM, rabbit immunoglob-ulin G-treated AM; NF-κB, nuclear factor-κB.
