
Figure 3.
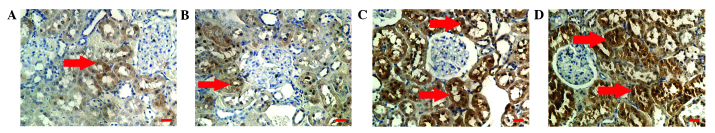
Immunohistochemical analysis images (magnification, x200) demonstrating the expression of klotho in the kidneys of DM rats treated with (A) PBS (DM-PBS group), (B) GFP (DM-GFP group) and (C) mKL (DM-mKL group), as well as (D) SD rats treated with PBS (SD-PBS group). Scale bar=25 μm. The arrows indicate the protein expression of klotho in the renal tubule epithelial cells (brown staining). n=7 in each group. DM, diabetic; PBS, phosphate-buffered saline; GFP, green fluorescent protein; mKL, mouse klotho; SD, Sprague-Dawley.