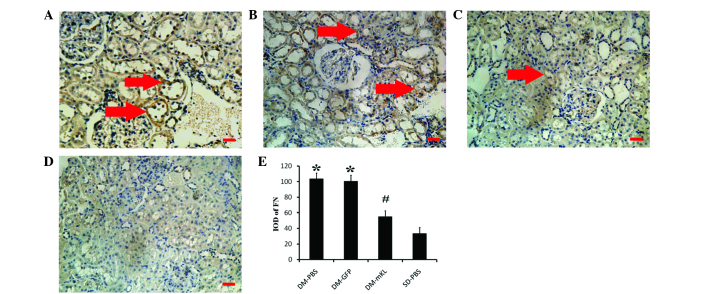
Figure 4.
Immunohistochemical analysis (magnification, x200) of the expression of FN in kidney tissues obtained from DM rats treated with (A) PBS (DM-PBS group), (B) GFP (DM-GFP group) and (C) mKL (DM-mKL group), as well as (D) SD rats treated with PBS (SD-PBS group). Scale bar=25 μm. The arrows indicate the protein expression of FN in the extracellular membrane of the renal tubule epithelial cells (brown staining). (E) Quantitative analysis of the protein expression of FN. The data are expressed as the mean ± standard error of the mean. *P<0.05, vs. SD-PBS group; and #P<0.05, vs. DM-PBS group. n=7 in each group. FN, fibronectin; DM, diabetic; PBS, phosphate-buffered saline; GFP, green fluorescent protein; mKL, mouse klotho; SD, Sprague-Dawley.

