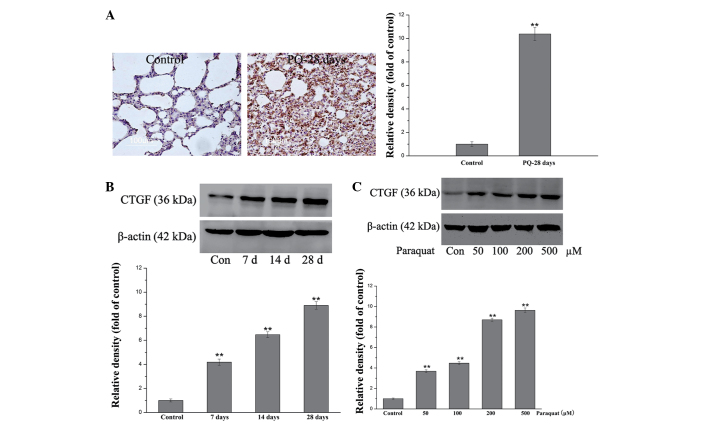
Figure 3.
PQ-induced CTGF expression in rat lungs and MRC-5 human lung fibroblast cells. (A) Immunohistochemistry of CTGF in lung tissue 28 days after PQ administration. (B) Western blot analysis of CTGF in lung tissues 7, 14 and 28 days after PQ exposure (P<0.01). (C) Western blot analysis of CTGF in MRC-5 cells exposed to 50, 100, 200 and 500 μM of PQ. Western blot bands were quantified using densitometry analysis and normalized to the expression of β-actin. Densitometry data are presented as the mean ± standard deviation. **P<0.01 vs. the control group (n=6) for each experiment. PQ, paraquat; CTGF, connective tissue growth factor.

