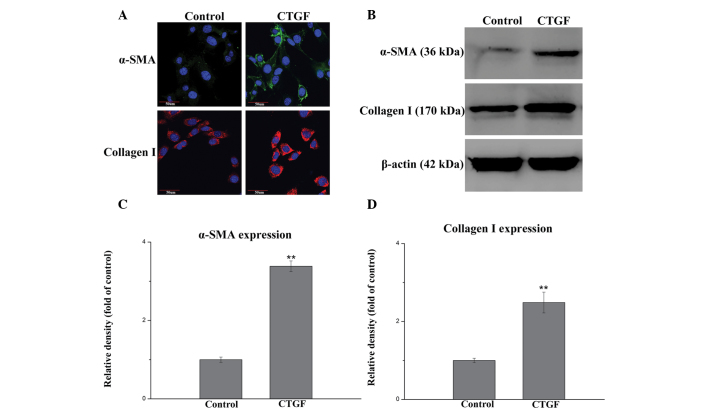
Figure 5.
CTGF-induced differentiation of MRC-5 lung fibroblasts into myofibroblasts. (A) Immunofluorescence analysis of α-SMA and collagen I in MRC-5 fibroblasts following treatment with CTGF for 3 days. Magnification, ×600 (scale bar=50 μm). (B) Western blot analysis of α-SMA and collagen I in whole cell lysates. β-actin was used as a loading control. Quantitative analysis of western blot results of (C) CTGF-induced α-SMA expression and (D) collagen I expression. Protein bands were quantified by densitometry and normalized to the expression of β-actin. Densitometry data are presented as the mean ± standard deviation. **P<0.01 vs. the control group. n=6 for each group. α-SMA, α-smooth muscle actin; CTGF, connective tissue growth factor.

