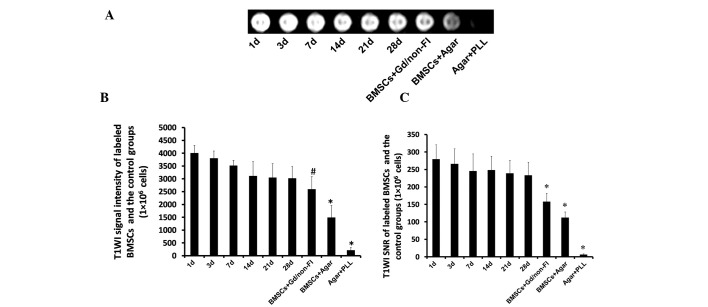
Figure 4.
MRI signal intensity and durability at different time-points in labeled cells. (A) A total of 1×10⁶ cells were detected by clinical MRI. The T1WI signal and relevant SNR of BMSCs were observed to be attenuated with progressing cell division and proliferation. (B and C) The MRI-derived quantitative T1WI signal intensity and SNR data of labeled BMSCs increased significantly from 1–28 days compared with that in non-labeled BMSCs (BMSCs + Agar) (*P<0.05). The MRI signal intensity in the labeled groups at 1, 3 and 7 days subsequent was higher than that in BMSCs with Gd but non-FI (BMSCs + Gd/non-FI) (#P<0.05). MRI, magnetic resonance imaging; T1WI, T1 weighted image; SNR, signal-to-noise ratio; BMSCs, bone marrow stromal cells; Gd/FI, gadodiamide/FI-Arrest In reagent; PLL, poly lysine.

