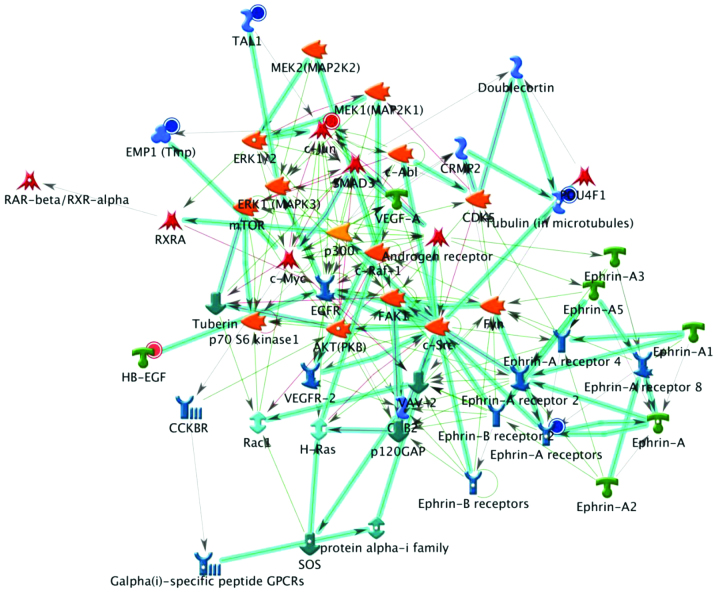
Figure 1.
Top scored (by the number of pathways) AN network, as determined using GeneGo_cat_FC2 analysis. Thick cyan lines indicate the fragments of canonical pathways. Upregulated genes are marked with red circles and downregulated genes are indicated with blue circles. FC, Fold Change 2.0; AN, Analyze Networks algorithm.

