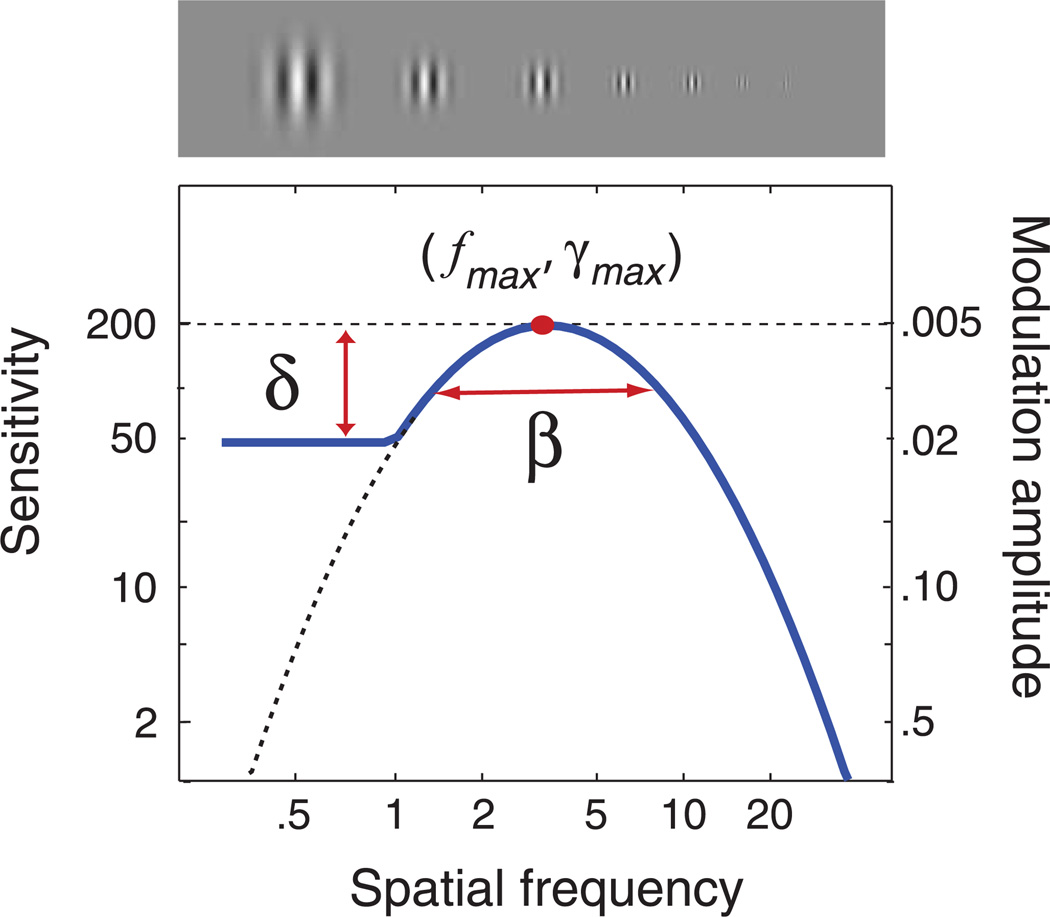
Figure 1.
CSF parameterization. The spatial contrast sensitivity function, which describes reciprocal contrast threshold as a function of spatial frequency, can be described by four parameters: (1) the peak gain, γmax; (2) the peak frequency, fmax; (3) the bandwidth (full-width at half-maximum), β; and (4) the truncation (plateau) on the low-frequency side, δ. The qCSF method estimates the spatial CSF by using Bayesian adaptive inference to directly estimate these four parameters.

