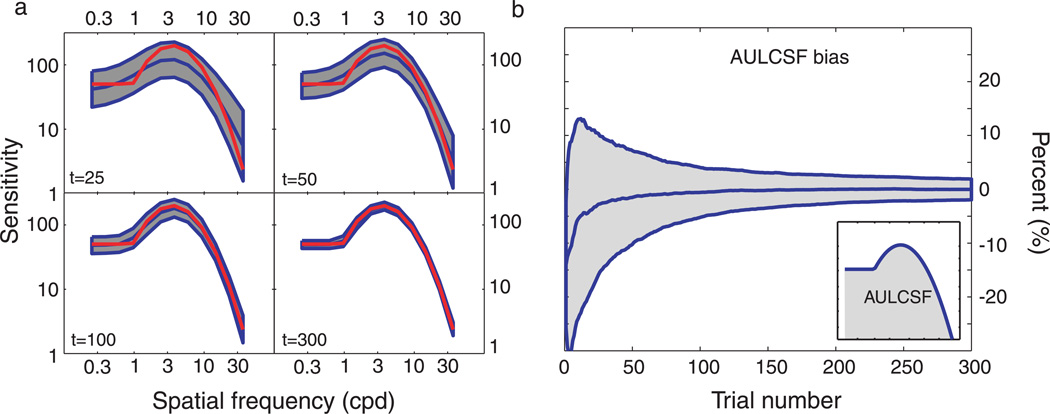
Figure 2.
Simulations. (a) CSF estimates obtained with 25, 50, 100, and 300 trials of the qCSF method. The general shape of the CSF is recovered with as few as 25 trials, but sensitivity estimates are imprecise (shaded regions reflect ±1 SD for individual frequencies). Method convergence with increasing trial numbers (50–300 trials) is supported by (1) the increasing concordance of mean qCSF estimates (red) with the true CSF (blue), and (2) the decreasing area of the error regions. (b) Expected bias of AULCSF estimates as a function of trial number. Evidence for the successful rapid estimation of the AULCSF is provided by (1) the convergence of the mean bias to zero and (2) the decreasing area of the error region (±1 standard deviation) as a function of increasing trial number.

