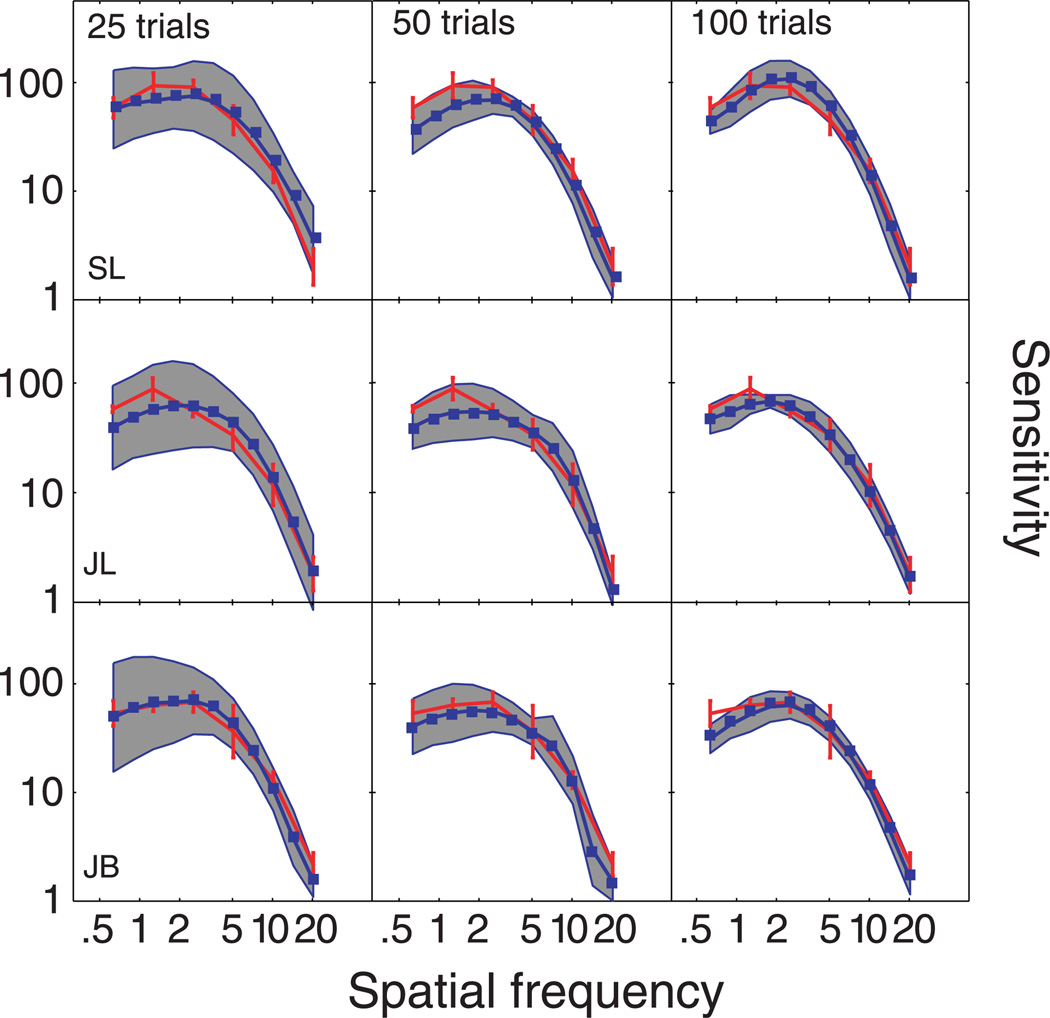
Figure 4.
Test accuracy. Spatial CSFs obtained with two independent and concurrent adaptive procedures: the qCSF method (blue) and the ψ method (red). CSF estimates obtained from different subjects are presented in different rows; estimates obtained with 25, 50, or 100 trials are presented in different columns. The gray-shaded region reflects the variability of qCSF estimates (8 runs in total), and the red error bars reflect variability of ψ estimates (4 runs in total).

