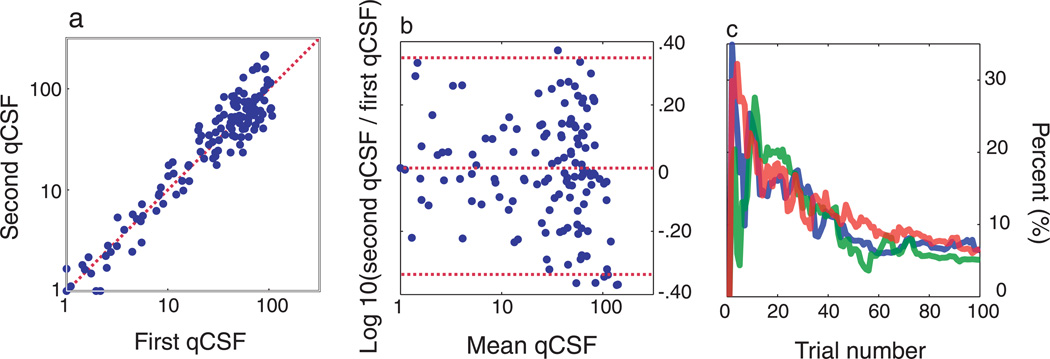
Figure 5.
Test precision. (a, b) Test–retest comparisons for the two qCSF runs (of 100 trials) applied in each testing session. (a) Contrast sensitivities measured with the second qCSF run plotted against those obtained in the first run. The Pearson correlation coefficient for these comparisons averaged, r = 96% (SD = 4%), across all testing sessions. (b) A Bland–Altman plot presents the differences between sensitivity estimates obtained from each qCSF run, plotted against their mean. Mean difference <0.01 and the standard error of the difference = 0.175 log units. (c) Coefficient of variability (in percent) of AULCSF estimates obtained from three observers (8 runs each), as a function of trial number. AULCSF estimates converge in agreement with simulations (<15% by the completion of 25 trials).

