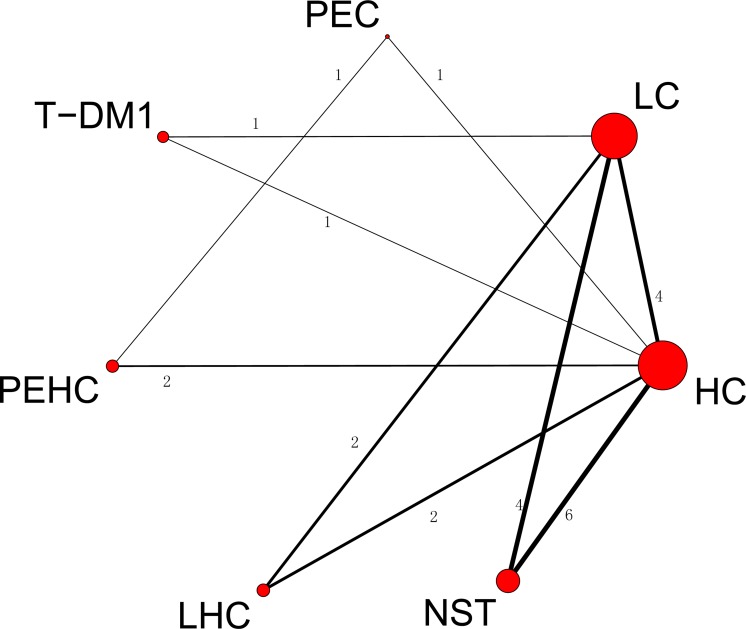
Fig 2. Network of comparisons for overall response rate.
The size of the nodes corresponds to the number of treatment study trials. Direct comparison treatments are linked with a line noting the number of trials. The thickness of the line corresponds to the number of trials that studied this comparison. Node: T-DM1; LC, lapatinib; HC, trastuzumab; NST, naïve standard treatments; PEHC, pertuzumab and trastuzumab; PEC, pertuzumab; LHC, lapatinib and trastuzumab.

