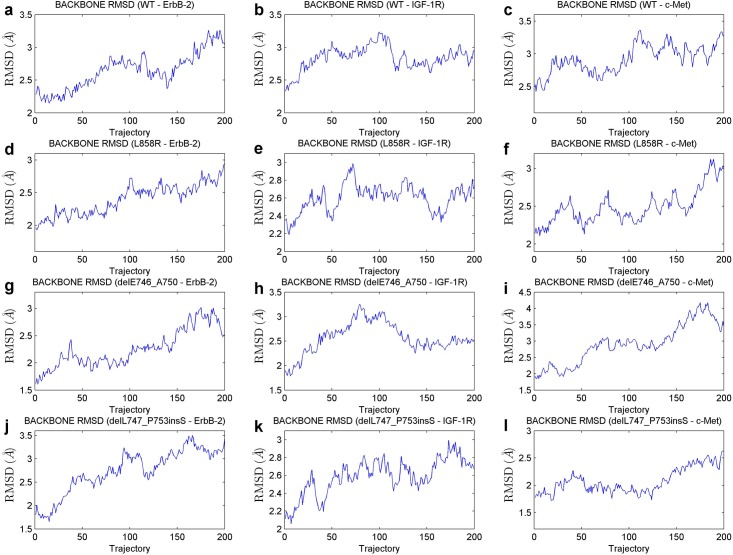
Fig 4. Backbone RMSD curves of several EGFR mutant-partner systems in the 2-ns production MD simulations.
(a) to (c), The RMSD curves for the WT—ErbB-2, WT—IGF-1R and WT—c-Met systems, respectively. (d) to (f), The curves for the mutant L858R-related systems. (g) to (i), The scenarios where the mutant delE746_A750 is involved. (j) to (l), The curves for the systems concerning mutant delL747_P753insS.

