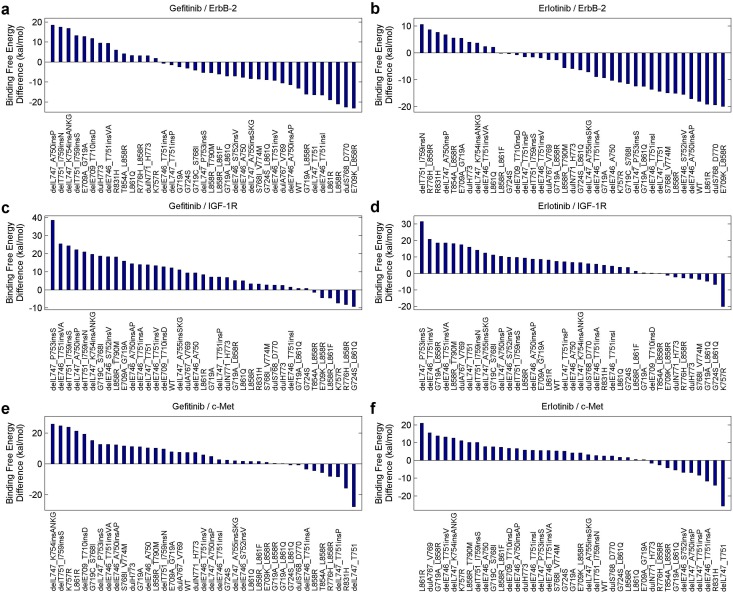
Fig 7. The difference between the total binding free energies of the mutant-inhibitor system and the mutant-partner system for each mutant.
(a) and (b), The binding free energy differences between the systems involving ErbB-2 and the two inhibitors (gefitinib and erlotinib), with the values ranked in the descending order. (c) and (d), The similar binding free energy differences between the systems concerning IGF-1R and the two inhibitors. (e) and (f), The binding free energy differences between the systems concerning c-Met and the two inhibitors.

