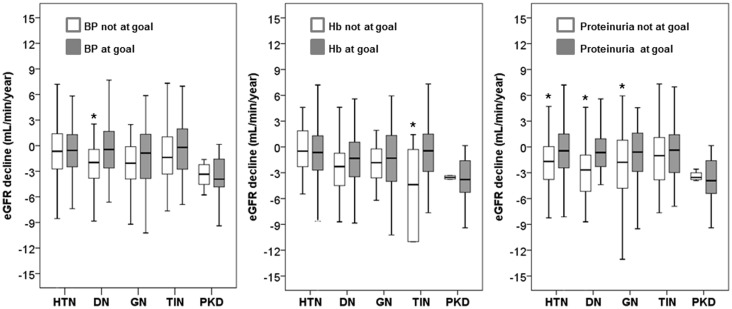
Fig 2. Box plots of decline of renal function, estimated as eGFR slope, in the five categories of diagnosis and by goal status at the beginning of follow up for renal survival (month 12 visit).
Limits of boxes are 25th and 75th percentiles, with the thick line across the boxes being the median value. Whiskers indicate either the minimum and maximum values or a distance of 1.5 times the interquartile range from the edge of the box (whichever distance is smaller). *P<0.05 versus achieved goal. See Methods for definition of goal values.

