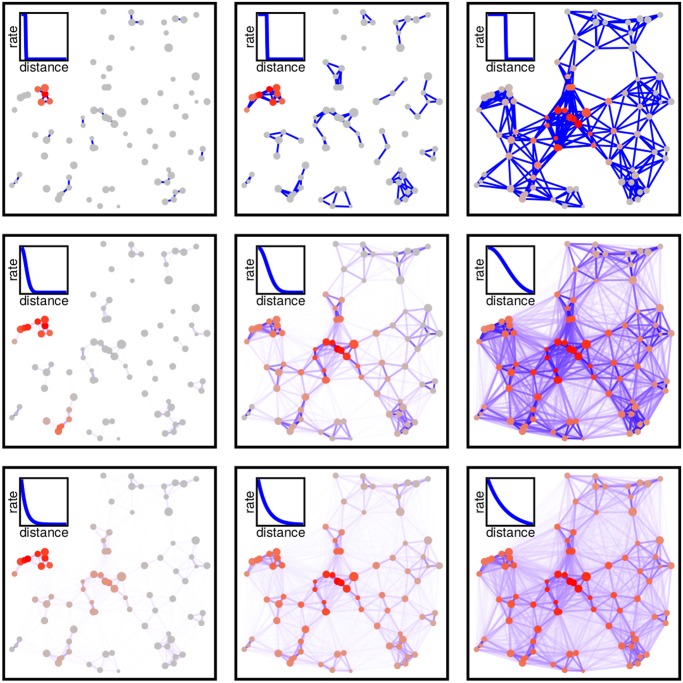
Fig 1. Fragmented landscapes as networks.
Different rows represent different dispersal kernels (top to bottom: Rectangular, Gaussian and Exponential, as depicted in the panel insets). Columns represent increasing values of the dispersal length ξ. The size of the points stands for the patch value A i, while their color measures the probability of occupancy p i (gray → low probability, red → high probability). The color of the edges measures their strength (white to blue). In all the panels δ = 0.9λ, where λ is the metapopulation capacity, and δ is the background extinction rate (see Eq 3).

