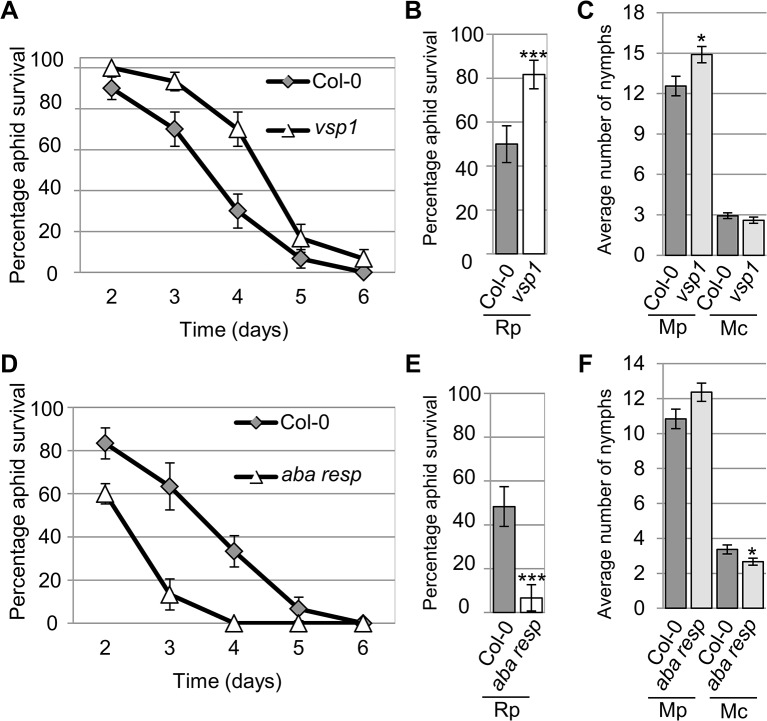
Fig 6. Arabidopsis knock-out mutants show altered susceptibility to Myzus persicae, Myzus cerasi and Rhopalosiphum padi.
(A) Graph showing R. padi aphid survival on the control (Col-0) and a vsp1 mutant line over 6 days. Five adult aphids were placed on four-week old plants and survival was monitored the following 6 days. Three independent biological replicates were carried out, with 10 plants per replicate. Error bars indicate standard error. (B) Graph shows the percentage of R. padi survival between day 3 and 4 on a vsp1 mutant line and Col-0 wild-type plants. Data is from the same experiment as described in (A). The two-tailed Student's t-test was used for statistical analyses (*** indicates p-value<0.001). Error bars indicate standard error. (C) M. persicae and M. cerasi performance on an Arabidopsis vsp1 knock-out line and Col-0 wild-type plants. Four-week old plants were exposed to two adult aphids and nymph production was counted after 10 days. Average nymph was calculated from three independent replicated experiments, with 10 plants per replicate per treatment. The two-tailed Student's t-test was used for statistical analyses (* indicates p-value<0.05). (D) Graph showing R. padi aphid survival on the control (Col-0) and a mutant line for an Arabidopsis gene predicted to encode an ABA-responsive protein over 6 days. Same experimental set-up and analyses as described in A. Error bars indicate standard error. (E) Graph showing the percentage of R. padi survival between day 3 and 4 on a mutant line for an Arabidopsis gene predicted to encode an ABA-responsive protein and Col-0 wild-type plants. Data are from the same experiment as described in D. The two-tailed Student's t-test was used for statistical analyses (*** indicates p<0.001). Error bars indicate standard error. (F) M. persicae and M. cerasi performance on a mutant line for an Arabidopsis gene predicted to encode an ABA-responsive protein and Col-0 wild-type plants. Same experimental set-up as described in (C). The two-tailed Student's t-test was used for statistical analyses (* indicates p-value < 0.05).

