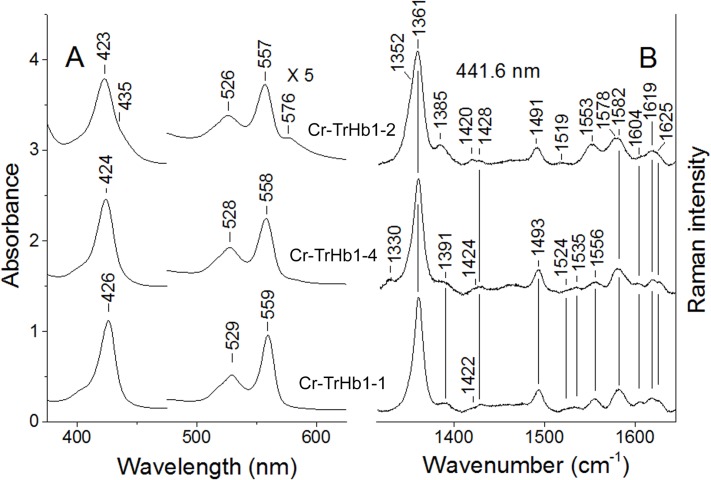
Fig 4. Absorption spectra (panel A) and resonance Raman spectra in the high-frequency region (panel B) of ferrous Cr-TrHb1-1, Cr-TrHb1-2, and Cr-TrHb1-4.
The resonance Raman spectra were obtained with excitation wavelength at 441.6, 1. Experimental conditions: 1 cm−1 resolution and 15 mW laser power at the sample; the total accumulation time was 20 min for Cr-TrHb1-2, 15 min for Cr-TrHb1-4, and 10 min for Cr-TrHb1-1. Spectra were obtained at pH 7.0 and 20°C. Spectra have been shifted along the ordinate axis to allow better visualization.

