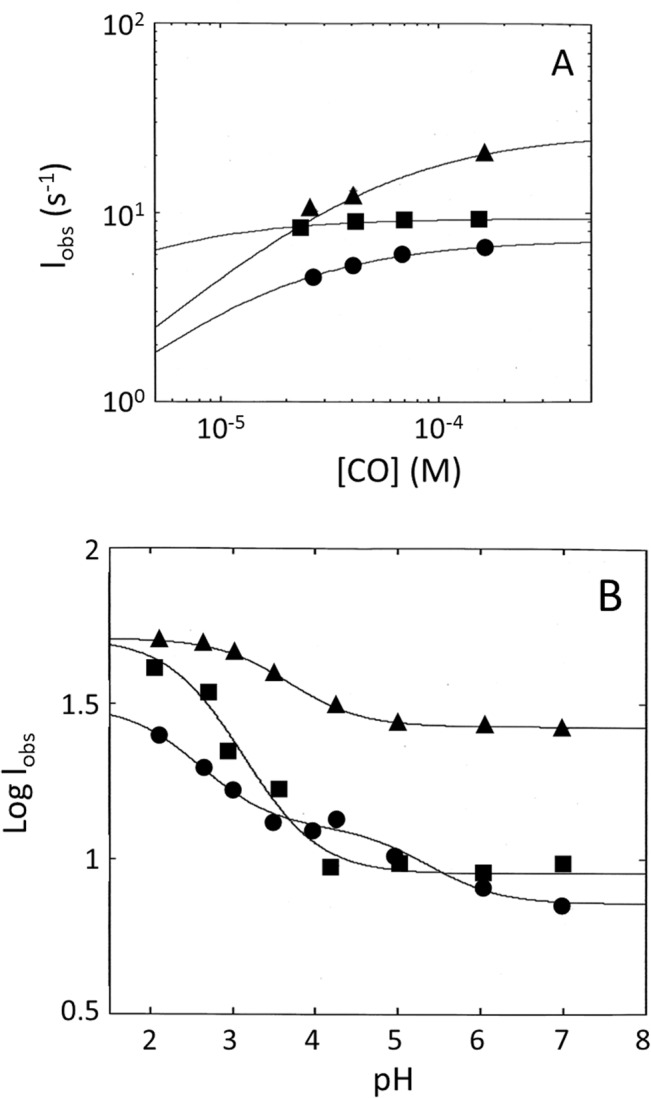
Fig 10. (Panel A) Effect of the CO concentration on the observed rate constant l obs for Cr-TrHb1-1 (●), Cr-TrHb1-2 (■), and Cr-TrHb1-4 (▲) CO binding.

Continuous lines have been obtained by non-linear least-squares fitting of data according to Eq (2C) with parameters reported in Table 1. Data were obtained at pH 7.0 and 20°C. (Panel B) pH dependence of the observed rate constant l obs for Cr-TrHb1-1 (●), Cr-TrHb1-2 (■) and Cr-TrHb1-4 (▲) CO binding. Continuous lines have been obtained by non-linear least-squares fitting of data according to Eq (3) with parameters reported in Table 1. Data were obtained at 20°C.
