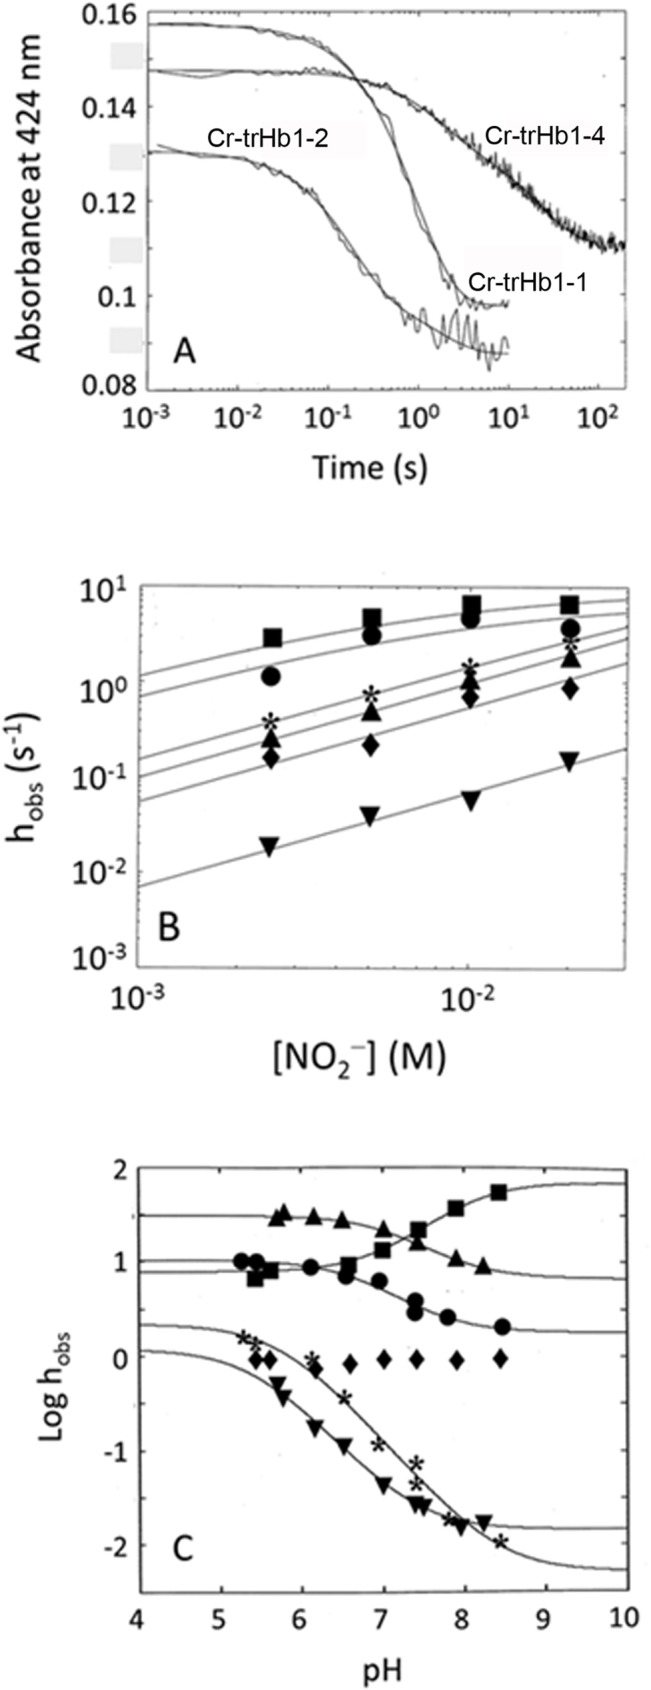
Fig 14. (Panel A) Time course of the absorption spectral changes at 424 nm for the reaction of Cr-TrHb1-1 (●), Cr-TrHb1-2 (■) and Cr-TrHb1-4 (▲) with NO2 −.

The sodium nitrite concentration was 10 mM. Continuous lines correspond to the non-linear least-squares fitting of data according to Eq 1, employing parameters reported in Table 2. (Panel B) NO2 − concentration dependence of the observed rate constants h obs for Cr-TrHb1-1 (● for the fast phase, * for the slow phase), Cr-TrHb1-2 (■ for the fast phase, ♦ for the slow phase), and Cr-TrHb1-4 (▲ for the fast phase, ▼ for the slow phase) catalyzed conversion of NO2 − to NO. The continuous lines have been obtained by non-linear least-squares fitting of data according to Eqs (2C) and (4) with parameters reported in Table 2. Data were obtained at pH 6.6 and 20°C. (Panel C) pH dependence of the observed rate constant h obs for the conversion of NO2 − to NO by Cr-TrHb1-1 (● for the fast phase, * for the slow phase), Cr-TrHb1-2 (■ for the fast phase, ♦ for the slow phase), and Cr-TrHb1-4 (▲ for the fast phase, ▼ for the slow phase). The continuous lines have been obtained by non-linear least-squares fitting of data according to Eq 3 with parameters reported in Table 2. Data were obtained at 20°C.
