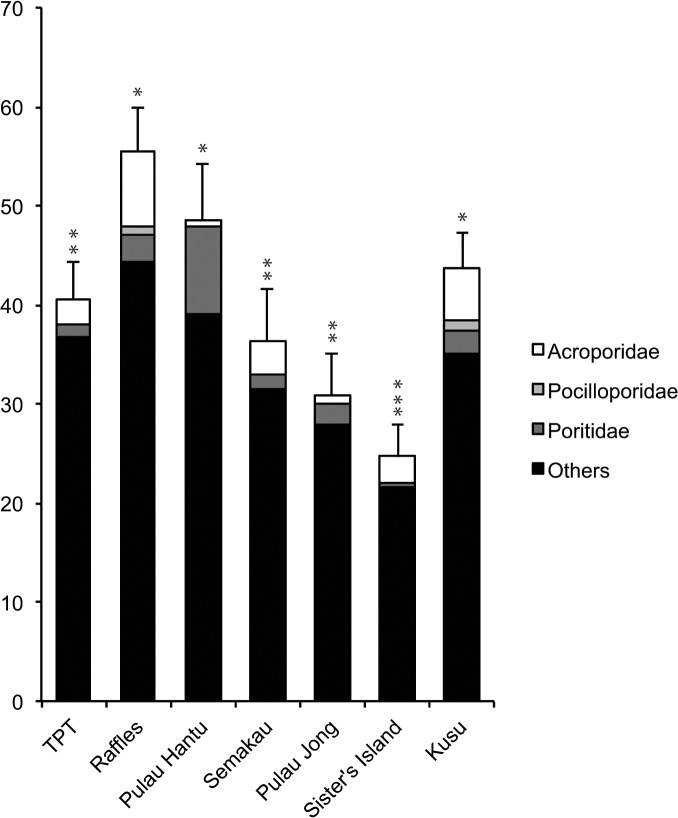
Fig 5. Percent coral cover at each site for Acroporidae, Pocilloporidae, Poritidae and ‘others’.
Data are means ± SE, and asterisks (*) indicate significant differences among sites (Tukey’s comparison test, p <0.05). Sites arranged from west to east (see Fig 1).

