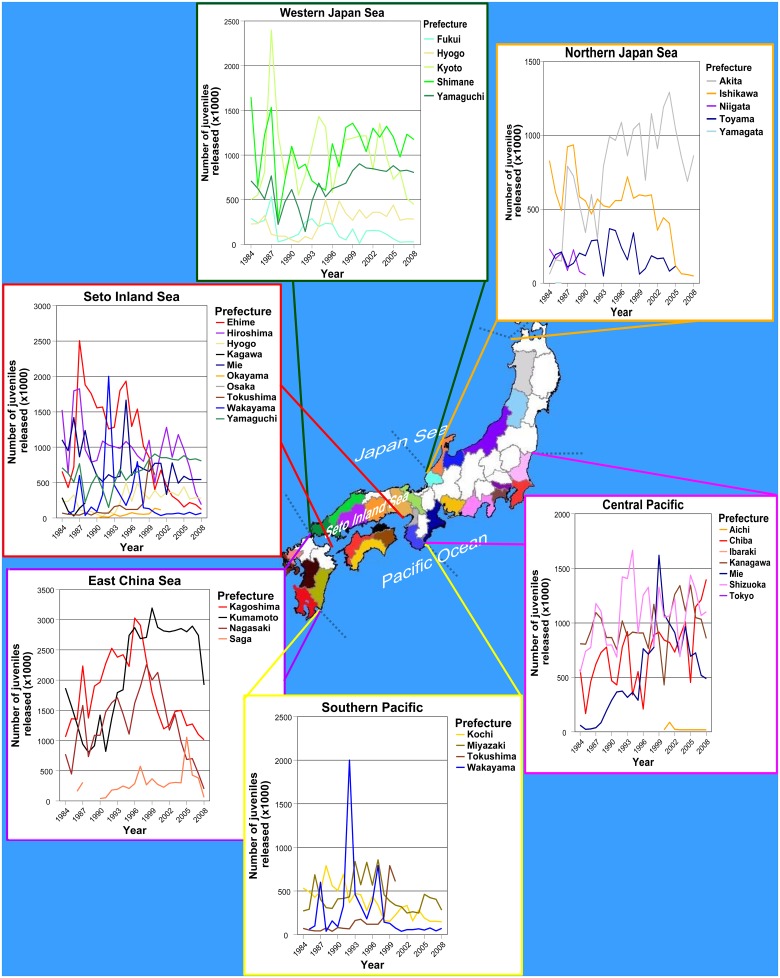
Fig 2. Annual variation in number of red sea bream juveniles releases (x1000) by prefectures (colored areas) and regions (dashed grey lines).
For each region, colors of the prefectures in the map correspond to those used to represent the annual variation in number of releases. Note that no releases have been performed in Hokkaido and the Northern Pacific region.

