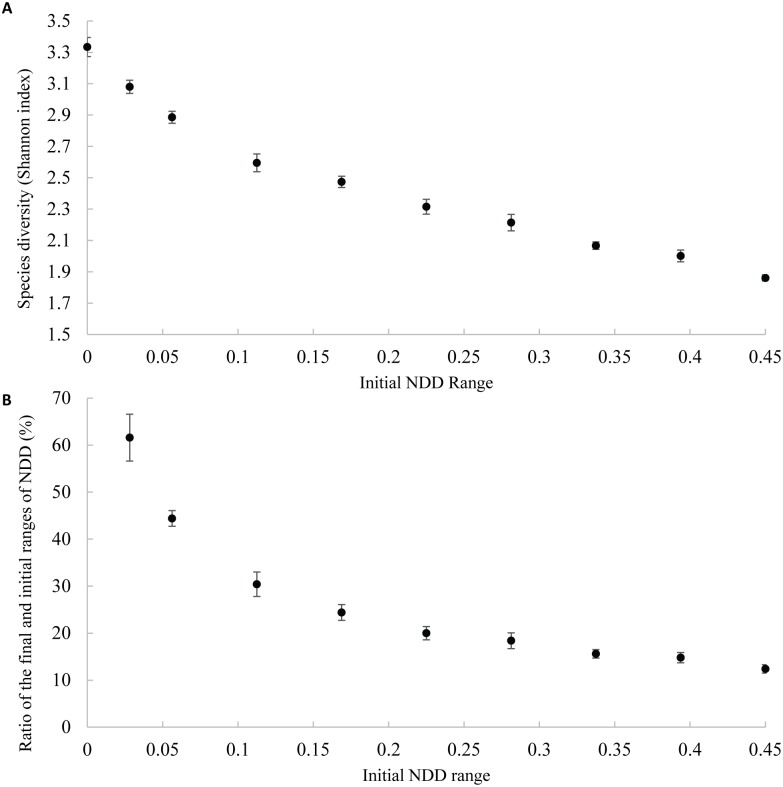
Fig 5. Species diversity (Shannon index) of communities at the end of simulations when the range of NDD values varies between zero (narrower range) and 0.45 (wider range) (A), and relation between initial ranges of NDD and the ratio between final and initial ranges of NDD at the end of simulation (B).
Error bars represent the standard deviation over five repetitions.

