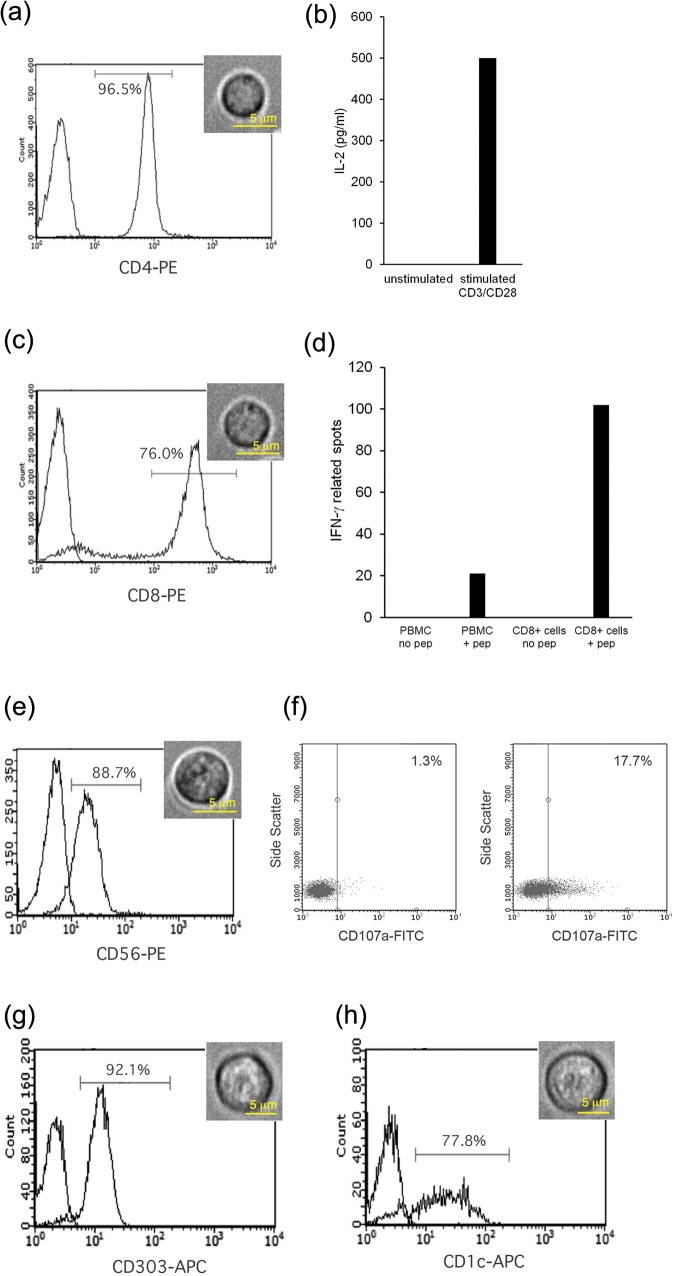
Fig 1. Flow cytometric and functional characterisation of purified cell subsets.
(a) CD4 staining of isolated CD4+ T cells. (b) IL-2 ELISA of CD4+ T cells stimulated with or without anti-CD3/CD28 beads. (c) CD8 staining or isolated CD8+ T cells. (d) IFNγ ELISPOT assay of PBMC and purified CD8+ T cells incubated with and without EBV derived peptide AVFDRKSDAK. (e) CD56 staining of isolated NK cells. (f) NK cell degranulation assay—CD107a staining of NK cells incubated without (left panel) or with (right panel) MHC class I deficient. 221 cells at a 10:1 effector to target ratio. (g) CD303 staining of isolated pDC. (h) CD1c staining of isolated mDC. The x-axis in each flow cytometry plot indicates fluorescent intensity. The left hand peak in each flow cytometry plot indicates control staining with an irrelevant antibody. Representative white-light microscopy images of each of the purified cell populations used in Raman spectroscopy experiments are also shown.

