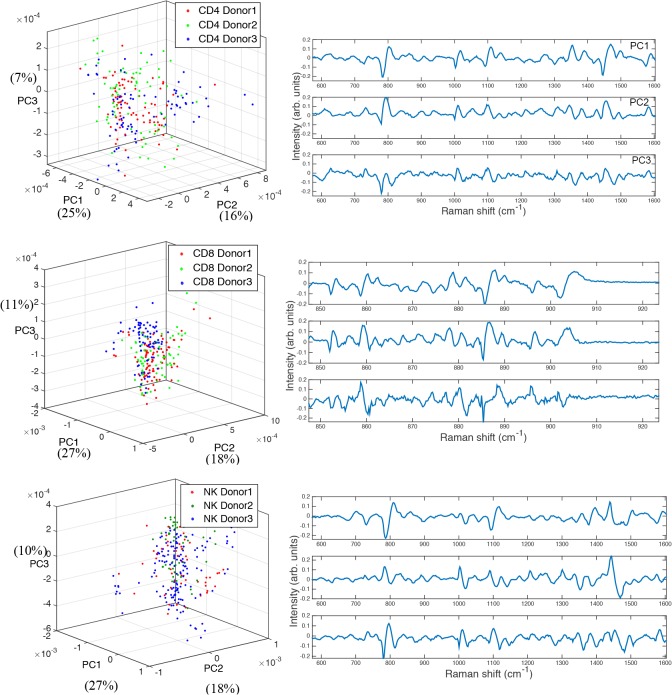
Fig 4. Cluster plots of the first three principal components for each cell type from three donors, with their corresponding first three loadings shown on the right.
(a) CD4+ T cells. (b) CD8+ T cells. (c) CD56+ NK cells. (3D rotating views of these plots are available to view in the supplementary information).

