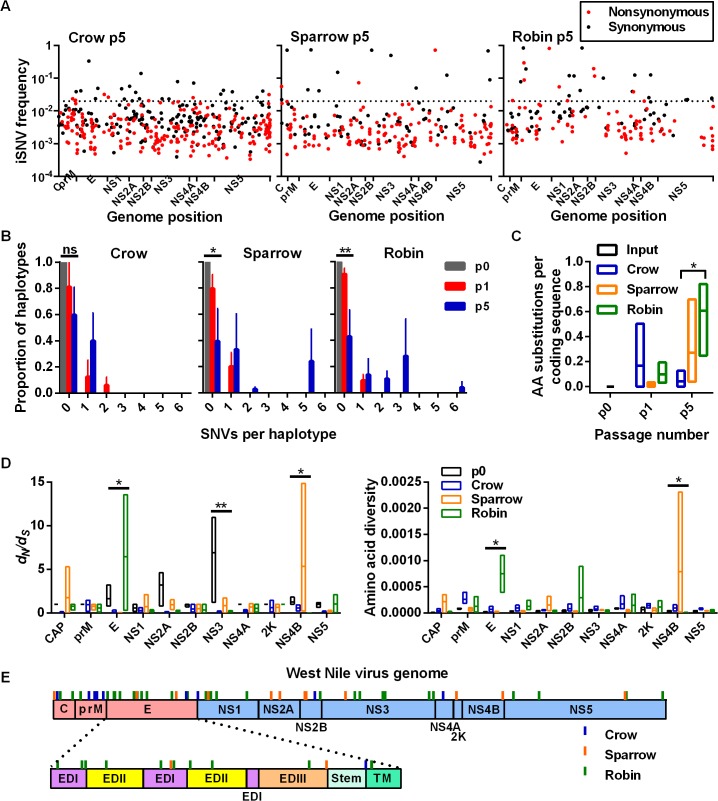
Fig 4. High-frequency iSNVs contribute to haplotype displacement in a bird-species dependent manner.
(A) iSNVs from input virus (p0) and after passage 5 (p5, all replicates combined) plotted according to genome position. Red and black dots represent synonymous and nonsynonymous iSNVs, respectively. Dotted line represents division between high and low frequency iSNVs (0.02). (B) Haplotypes were reconstructed from high frequency iSNVs represented by the number of SNVs per haplotype (i.e. Hamming distance from the p0 haplotype, ± SEM) (ns, not significant; *, P = 0.0250; **, P = 0.0036, Kruskal-Wallis test). (C) Mean (± range) number of amino acid (AA) substitutions per coding sequence from high frequency iSNVs at p5 in each bird species (*, crow p5 vs robin p5, P = 0.0429, Kruskal-Wallis test with Dunn’s correction). (D) Mean (± range) ratios of nonsynonymous to synonymous variants per site (d N /d S) (left) and amino acid diversity (right) from p0 and p5 for each WNV protein coding region. Left: * E protein, P = 0.0284; **, nonstructural protein 2A (NS2A), P = 0.0064; *, NS4B, P = 0.0175. d N /d S was set at 1 for replicates without synonymous single nucleotide variants (SNVs) and 0 without nonsynonymous SNVs in the coding region. Right: *, E, P = 0.0284; *, NS4B, P = 0.0328, Kruskal-Wallis test. (E) High frequency nonsynonymous iSNVs from all bird passages were plotted according to their position in the WNV genome. Individual high frequency iSNVs can be found in S2 Table.

