
Figure 4.
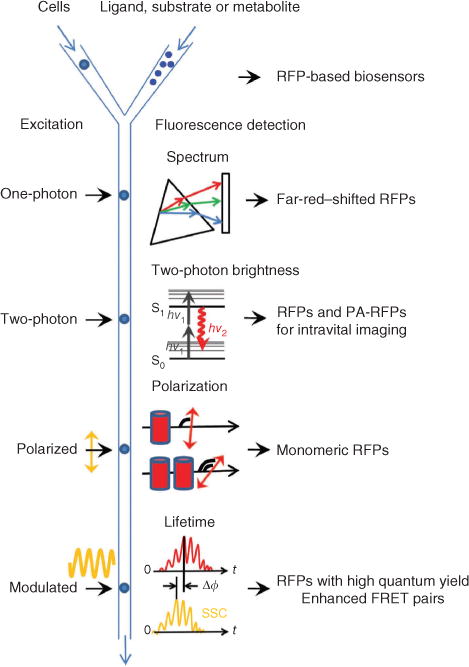
Possible FACS-based screening approaches for red-shifted fluorescent proteins. The respective red fluorescent proteins expected to result from each method are listed on the right. The schematic depicts cells or other hosts expressing fluorescent proteins being mixed with ligand, substrate or metabolite with different delays before fluorescence screening. A standard one-photon laser excites flowing cells, and the resultant fluorescent signal is dispersed with a diffraction grating (triangle) and projected onto an array detector (rectangle) for recording of a complete emission spectrum. A two-photon laser excites the cells with two low-energy photons (hv1) and the resulting fluorescence emission (hv2) is detected. Linearly polarized laser excitation and the emitted fluorescence signals have different degrees of polarization depending on the size of fluorescent molecules and FRET efficiency between them. Cylinders denote fluorescent proteins in monomeric and dimeric states. Modulated excitation (yellow sinusoid) results in a phase shift, Δϕ, between the fluorescence emission (red) and side-scattered excitation light (SSC; yellow), which is used to compute the average fluorescence lifetime of fluorescent proteins in a cell.