
Figure 7.
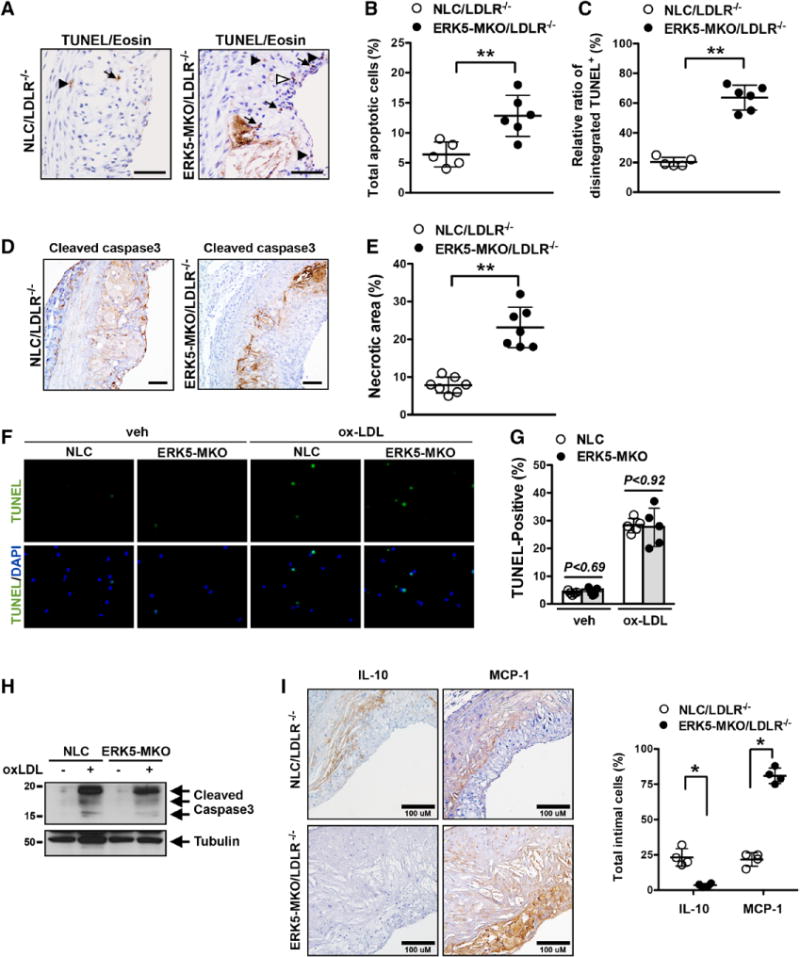
Increased apoptotic cell accumulation and necrotic core formation in ERK-MKO/low-density lipoprotein receptor (LDLR)−/− mice. A through C, Sections of proximal aortas from each group were labeled by terminal deoxynucleotidyl transferase–mediated dUTP nick end labeling (TUNEL) to detect apoptotic cells and counterstained with eosin to detect nuclei. Total TUNEL-positive (TUNEL+) cells were subdivided into intact (arrows) and disintegrated (sum of fragmented [open arrowhead] and degraded [closed arrowhead]) cells. Bars, 50 μm. B, Graph shows the percentage of TUNEL-positive cells (TUNEL+ cells/total cells counted) in the lesion area. More than 200 cells were counted in each section (n=5–6 per genotype). **P<0.01. C, The percentage of disintegrated TUNEL-positive cells (disintegrated TUNEL+ cells/total TUNEL+ cells) in the lesion area (n=5–6 per genotype). **P<0.01. D, Cleaved caspase 3 staining in the lesion area. Bars, 40 μm. E, Area occupied by the necrotic core (acellular lipid core) is shown as percentage of total lesion area. Data are expressed as mean±SD (n=7 per genotype); **P<0.01. F, Apoptosis was induced by incubation with oxidized low-density lipoprotein (ox-LDL; 100 μg/mL) or phosphate-buffered saline vehicle (veh) for 24 hours in peritoneal macrophages isolated from ERK5-MKO or nontransgenic littermate control (NLC) mice and detected by TUNEL staining. G, Percentage of TUNEL-positive cells. Data are mean±SD (n=5 per genotype). H, Cleaved caspase-3 expression induced by oxidized low-density lipoprotein in peritoneal macrophages isolated from ERK5-MKO or NLC mice. I, Area of atherosclerotic plaques in sections of the proximal aorta was stained with an antibody against monocyte chemotactic protein-1 (MCP-1; M1 phenotype) or interleukin-10 (IL-10; M2 phenotype), and values represent the number of MCP-1 or IL-10 cells/% of total intimal lesion area. Data are mean±SD (n=4 per genotype); **P<0.01. Comparison between 2 independent groups was subjected to Wilcoxon rank sum test.