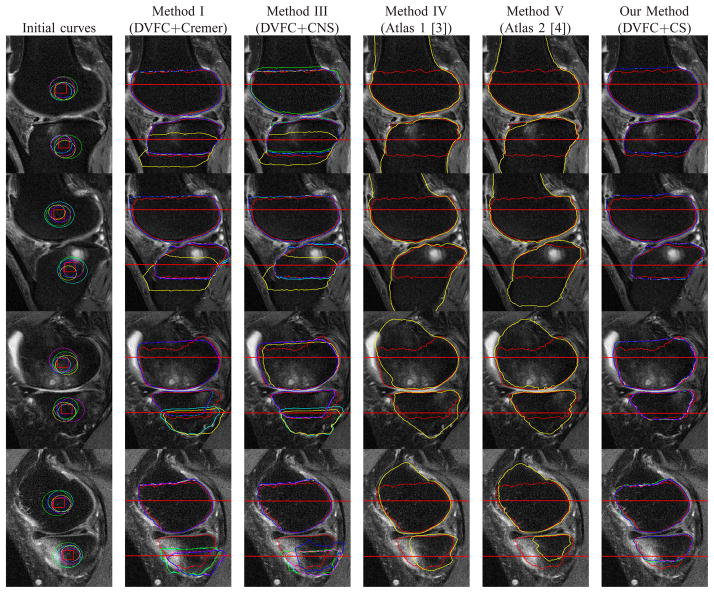
Fig. 8.
Example segmentation results for a number of images from data set discussed in Section III-A. Rows: individual cases. Column 1: Randomly generated initialing curves (circles). The centers of these circles uniformly distribute within the red squares and their radii uniformly distribute within 15 to 30. Columns 2, 3 and 6: the results based on Methods I (DVFC+Cremer), III (DVFC+CNS) and our method (DVFC+CS). Columns 4 and 5: red line denotes the ground truth, yellow line denotes the segmentation results based on Method IV and V. Different colors (yellow, blue, cyan, green and magenta) represent the results based on the corresponding initial curves in column 1 and the red line denotes the ground truth. The area near the joint where the AvgD is evaluated is denoted by red horizontal lines.

