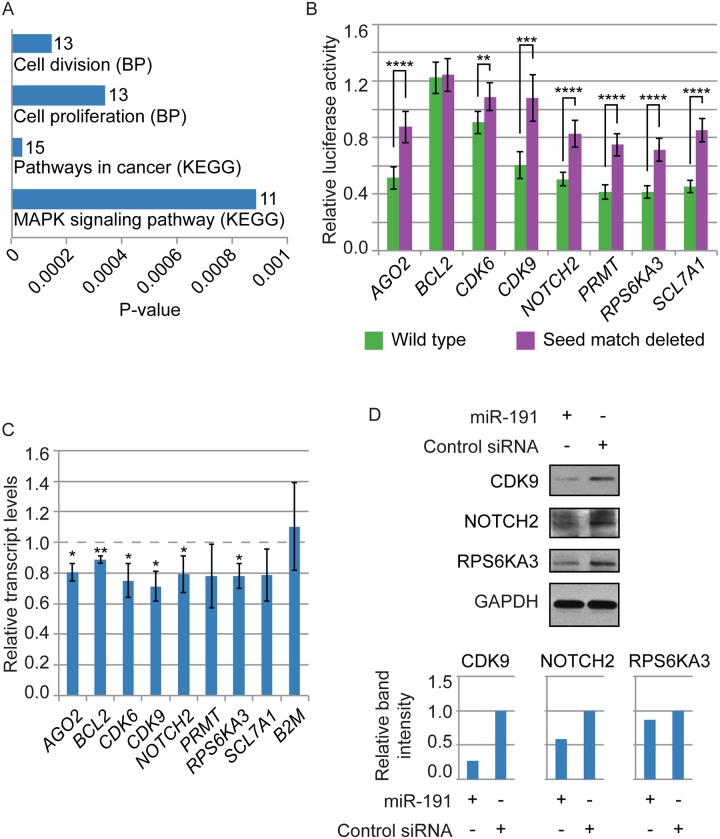
Fig 5. miR-191 directly targets multiple proto-oncogenes.
(A) Enriched Gene Ontology terms for the experimentally identified set of miR-191 targets. BP: Biological process. Numbers indicate gene counts. (B) Luciferase reporter assays showed miR-191 directly targets the 3’ UTRs of the genes indicated on the X-axis. The Y-axis denotes relative luciferase units from miR-191 transfected HEK293 cells normalized to Control siRNA transfected cells. Purple bars: 3’ UTRs with the putative miR-191 target site entirely deleted. Green bars: Intact 3’ UTRs. P-values were estimated by Student’s one tailed t-test comparing miR-191 normalized to Control siRNA luciferase activity with intact 3’ UTRs to normalized luciferase activity with miR-191 target site deleted 3’ UTRs. (C) miR-191 transfection significantly decreased AGO2, BCL2, CDK6, CDK9, NOTCH2, and RPS6KA3 transcript levels in fibroblasts. Fold changes are indicated on the Y-axis relative to the Control siRNA transfection. GAPDH was used to normalize input RNA levels. P-values were estimated by Student’s one tailed t-test comparing normalized transcript levels following miR-191 transfection to normalized transcript levels following Control siRNA transfection. (D) miR-191 transfection in fibroblasts decreased protein expression of CDK9, NOTCH2, and RPS6KA3 compared to Control siRNA transfection. Band intensities were quantified, normalized to GAPDH, and shown relative to the Control siRNA. For B and C, bars indicate the mean, and error bars denote ± SD, n = 6 and 3 respectively. *P < 0.05; **P < 0.01; ***P < 0.001; ****P < 0.0001.

