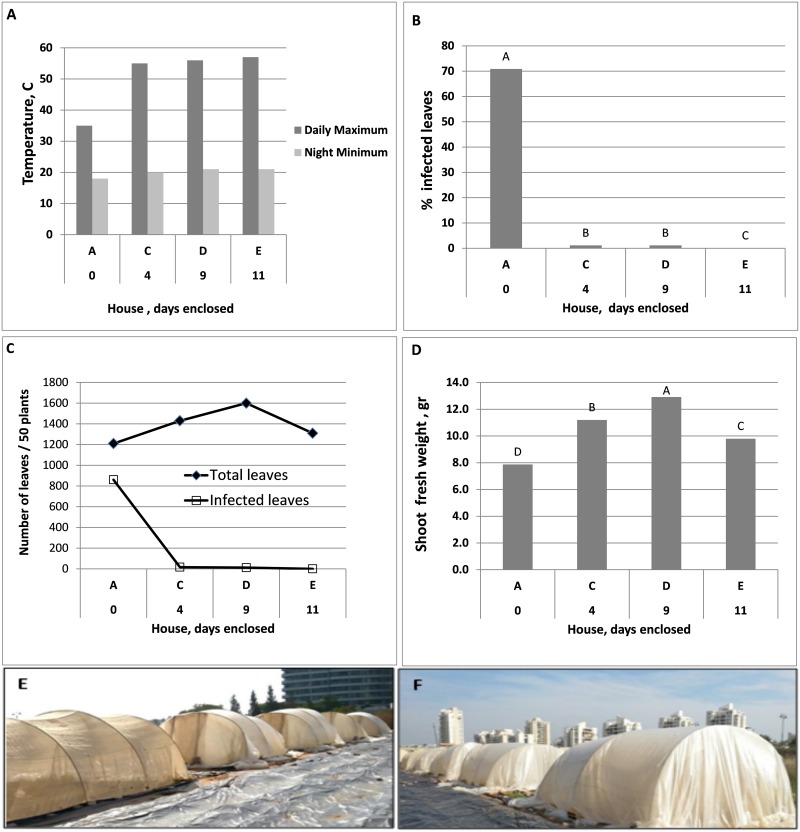
Fig 10. Suppression of downy mildew development by daytime solar heating applied to inoculated basil plants in three Houses C, D and E after being covered with PE for 4, 9 and 11 days, respectively compared to House A which was left uncovered.
A- Maximal and minimal daily temperatures recorded in Houses A, C, D and E. B- Percentage of infected leaves per plant in Houses A, C, D, E. C- Number of total and infected leaves per 50 plants harvested per House 14 days after planting. D- Average Shoot fresh weight [g] per plant and House. Different Letters indicate significant differences between means at α = 0.05 (Tukey’s HSD test). E- and F- a general view over net houses A-E before (E) and after (F) PE coverage.

