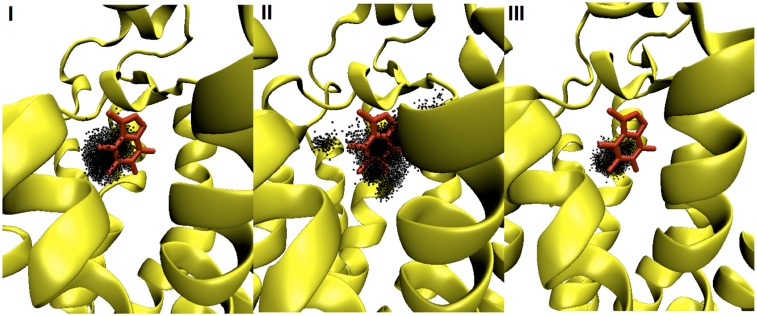
Fig 4. The distribution of CFF center of mass within the ligand-binding cavity of hA2AR across systems I-III.

The receptor and CFF are shown as yellow cartoon and red sticks, respectively. CFF center of mass at each collected frame over the last 400 ns of MD simulated time is depicted as one black dot.
