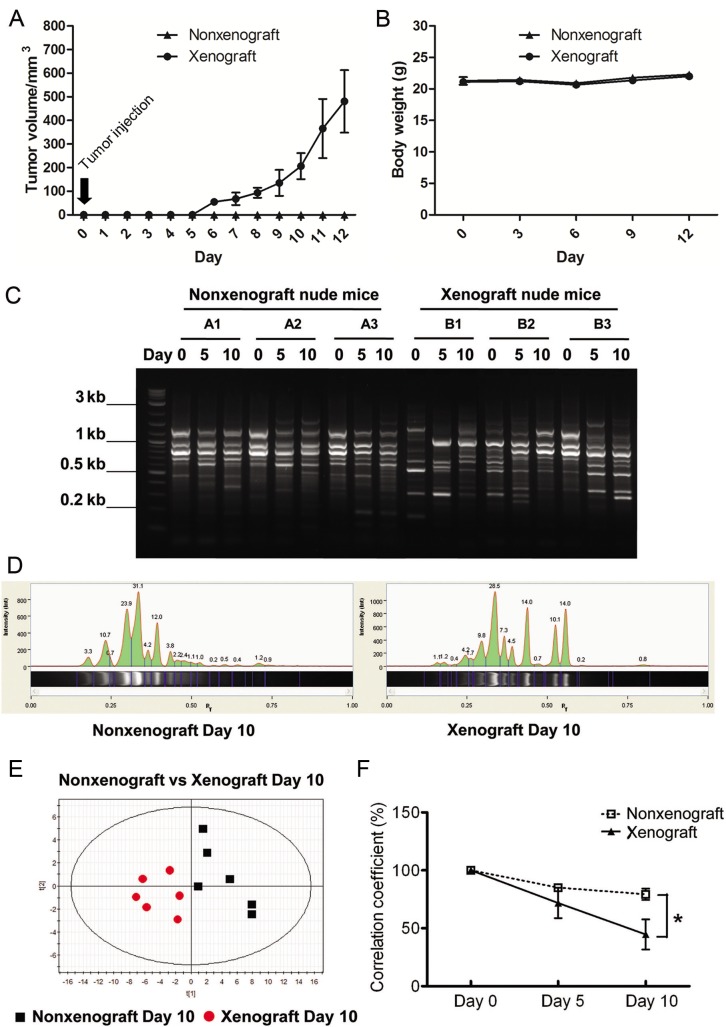
Fig 1. Comparison of fecal microbiota between nonxenograft and xenograft nude mice.
(A) Tumor growth curve. (B) Body wight. (C) Representative ERIC-PCR DNA fingerprints of the fecal microbiota of individual nonxenograft and xenograft nude mice. Fecal samples were collected before xenograft (Day 0), and 5 & 10 d upon saline or tumor cells injection. (D) Digitization of ERIC-PCR DNA fingerprints. Gel images were digitized by Image Lab 3.0 system (Bio-Rad). The peak area corresponded to the intensity of ERIC-PCR band shown in the gel image. (E) PLS-DA plot of ERIC-PCR data from fecal microbiota of nonxenograft and xenograft nude mice at Day 10. Black square: nonxenograft nude mice; Red dot: xenograft nude mice. (F) Correlation coefficients of fecal microbiota of nonxenograft and xenograft nude mice. All data were expressed as the percentage change over the Day 0 control of each mouse, and presented as the mean ± SEM (* P < 0.05, ** P < 0.01 versus nonxenograft group, n = 6/group).

