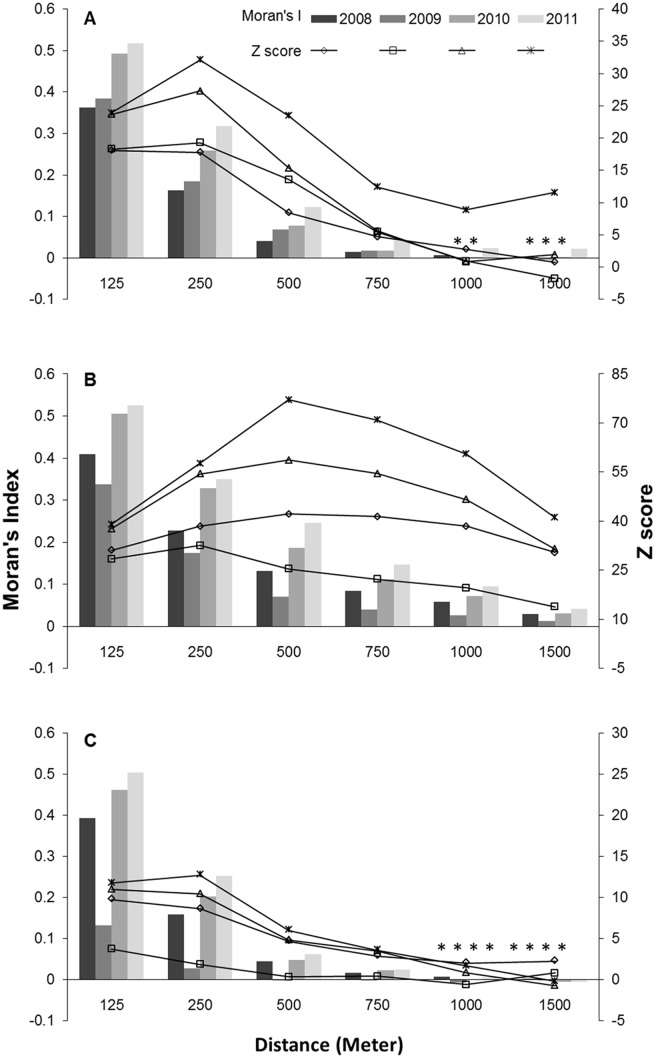
Fig 4. Moran’s Index and Z-scores in the variety of distance bands calculated for four study years.
Moran’s Index and Z-score calculated for each year at Discovery Bay (A), Julia Bank (B), and Julia Percy Island (C) analysis grids. Values greater than zero indicate the clustering of fishing effort (positive spatial autocorrelation), whereas values less than zero indicate dispersed fishing effort (negative spatial autocorrelation). Non-significant distances (p-value >0.05) are shown with star (*) for Moran’s I values.

