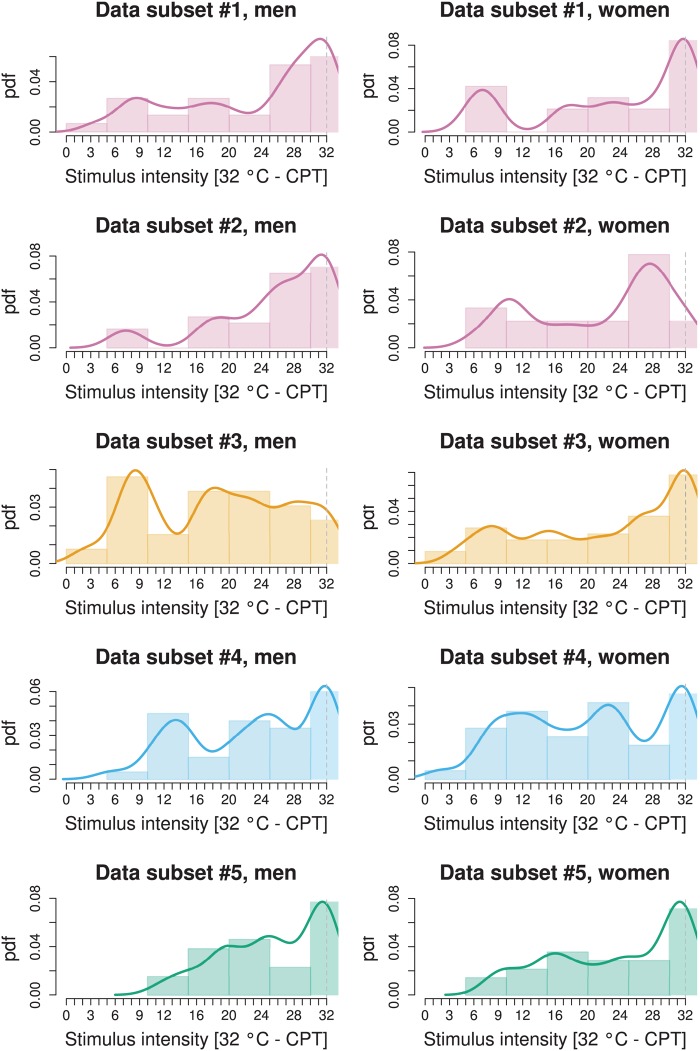
Fig 1. Distribution of cold pain thresholds as observed in the five different data sets (rows) corresponding to the four studies [11–14] as in study #1 [11], data was separated to accommodate the involvement of two observers in contrast to the other three studies where only a single observed had acquired the data (Table 1).
The four different studies are drawn in different color to enhance the association of data subsets with the study in which they have been acquired. The graph displays the data after rescaling for stimulus intensity as SI = 32°C - CPT to provide increasing stimulus intensity along the abscissa with increasing x. The lower limit of the applied stimulus intensity by the Thermal Sensory Analyzer is marked with a perpendicular dashed line. Data is shown as histograms and superimposed probability density functions (pdf, Gaussian kernel), separately for men and women (columns). For the main analysis, all data subsets shown here were pooled, log-transformed and mathematically modeled for multi-modality (Fig 3).

