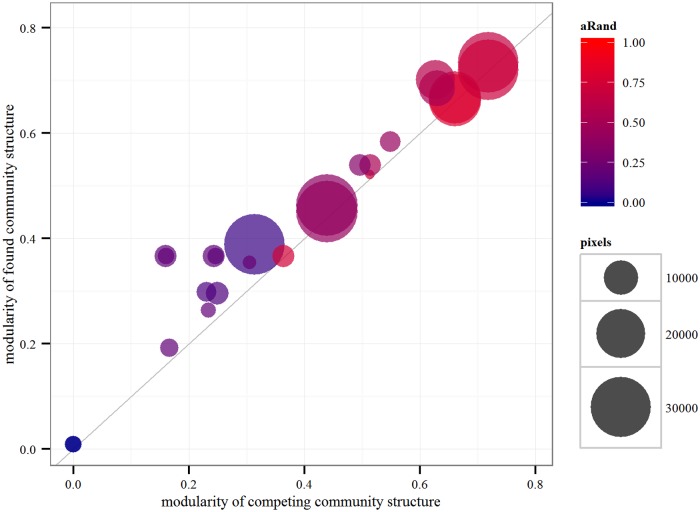
Fig 1. Regional graph partition comparisons.
Each point represents a comparison of two partitions of the same regional graph, i.e., one line from Table 3. The modularity of the partition found by our method is shown on the vertical axis while the modularity of the competing partition is given on the horizontal axis. Color shows the difference between the two partitions measured by the adjusted Rand index and the area of the disk is proportional to the number of pixels in the graph.

