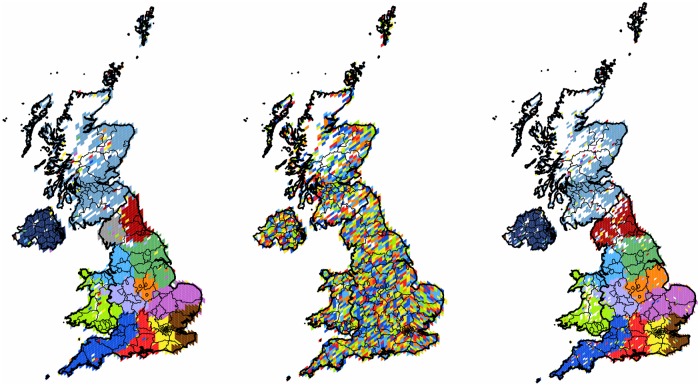
Fig 2. Clustering of the United Kingdom.
The first panel shows the 2,404 pixels forming 14 well defined clusters with modularity value of 0.37. The second panel shows the clusters of the randomly rewired graph with 6 clusters. The third panel shows the result of the graph with finer HEALPix grid with 13 clusters. On each map, each cluster of geo-pixels has a different unique color. The boundaries between the four countries are shown in thicker lines, while the second-level subnational division is indicated with finer lines, depicting the second type of administrative units analyzed.

