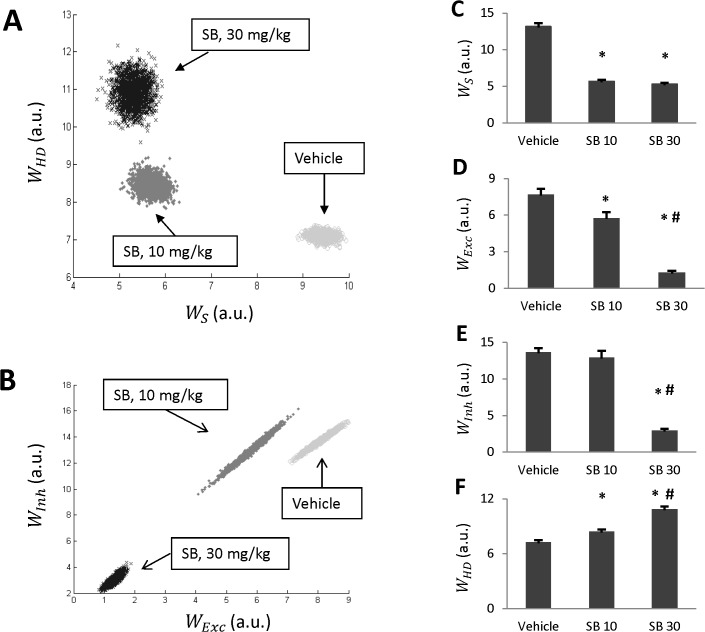
Fig 4. Parameter estimates generated by Monte-Carlo simulations.
A-B: Statistical ensembles of parameters (amplitude of stress, and Meth-sensitivities of three Meth-dependent populations) projected onto (w S, w HD)-plane (A) and (w Exc, w Inh)-plane (B) for each of the three doses of SB (vehicle, 10 and 30 mg/kg). C-F: Individual parameters for each dose of SB. * denotes statistically significant difference from vehicle (SB 0, p<0.05); #—between SB 10 and SB 30 (p<0.05).

