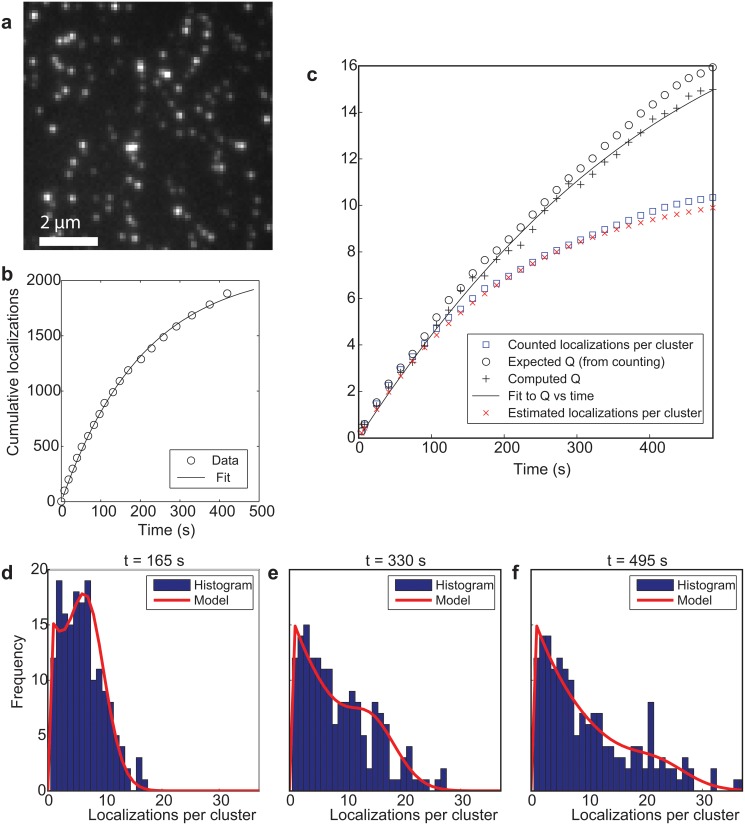
Fig 1. Quantitative localization microscopy with a single fluorophore per labeled site.
(a) Three state model with rates. (b) Cutout of total image of sparsely distributed DNA oligomers on glass labeled with single Alexa Fluor 647 dyes showing well-isolated clusters of localizations. (c) Cumulative number of localizations and single-exponential fit. (d) Correlation parameter Q determined from the spatial image correlations and fit with switching model shows agreement with the ground truth value determined from the cluster analysis. The estimated value for the average number of localizations ⟨M(t)⟩ shows agreement with the ground truth value determined from the cluster statistics. (e-g) Histograms of the number of localizations accumulated per cluster and model prediction at three time points during the image acquisition.

