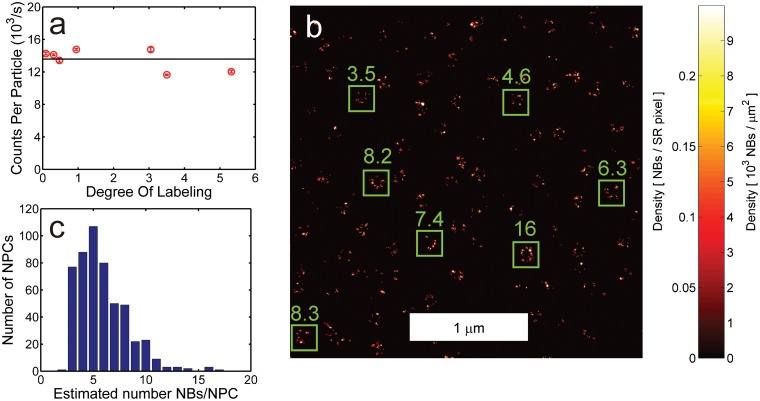
Fig 2. Quantitative localization microscopy of NB-labeled Seh1 in the NPC.
(a) FCS-analysis of NB stoichiometry indicating there is a single fluorophore per NB. (b) Cutout of quantitative localization microscopy image of NB-labeled Seh1 in the NPC (k bl = 4.8 × 10⁻³/s and M ∞ = 5.0). The numbers at the green boxes indicate the estimated number of NBs within the box. (c) Histogram of the estimated number of NBs per NPC.

