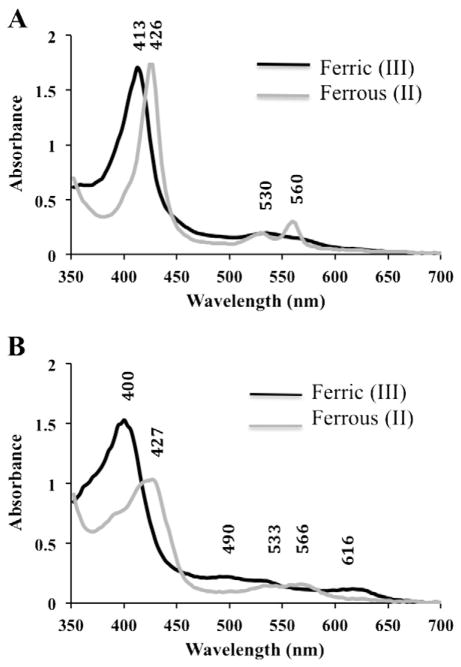
Fig. 1.
Electronic Absorption Spectra of HmbR. Purified HmbR in sample buffer (20 mM phosphate, pH 7.4, 500 mM NaCl) was subjected to UV-visible absorption scans either A) as purified (with 500 mM imidazole) or B) after removal of imidazole. Black lines represent the spectra of samples in the ferric state, and gray lines represent the spectra of samples reduced to the ferrous state by the addition of 5 mM sodium hydrosulfite to the sample. Each spectrum was obtained using 1.5 μL of protein at approximately 35 mg/mL on a nanodrop (ND-1000) spectrophotometer. Soret, α, and β peaks are indicated by their respective wavelengths within the graphs.

