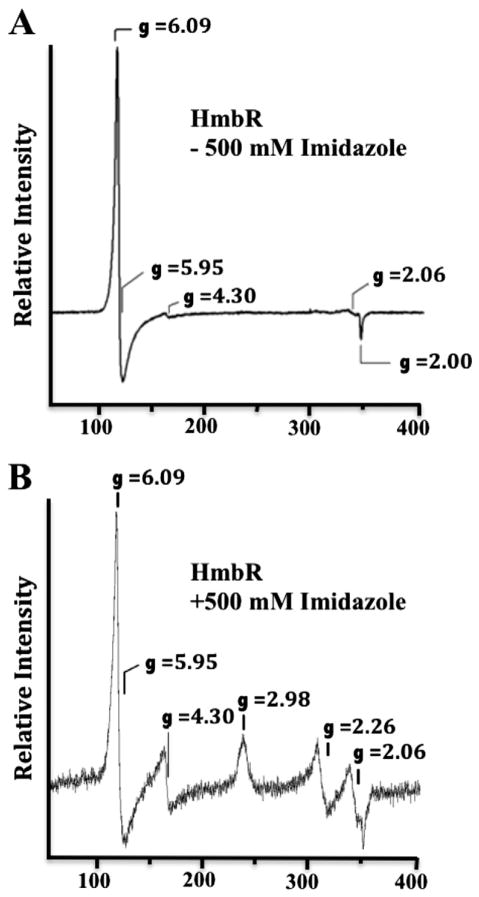
Fig. 3.
Electron paramagnetic resonance spectra of HmbR. EPR spectra were recorded on samples containing approximately 200 μM of HmbR in sample buffer (20 mM phosphate, pH 7.4, and Anzergent™3-14) either without imidazole (Panel A), or in the presence of 500 mM imidazole (Panel B). All data were collected using a Bruker ESP300D spectrometer equipped with an Oxford Instruments ESR-900 helium flow cryostat to maintain the temperature of the samples at 10 K. The modulation amplitude was 6.477 G with a modulation frequency of 100 kHz. The microwave frequency and power were 9.6 GHz and 5 mW, respectively. The signal at g = 4.3 is attributed to minute contamination of the protein sample by rhombic iron(III). The feature at g = 2.06 is attributed to copper contamination of the EPR cavity.

