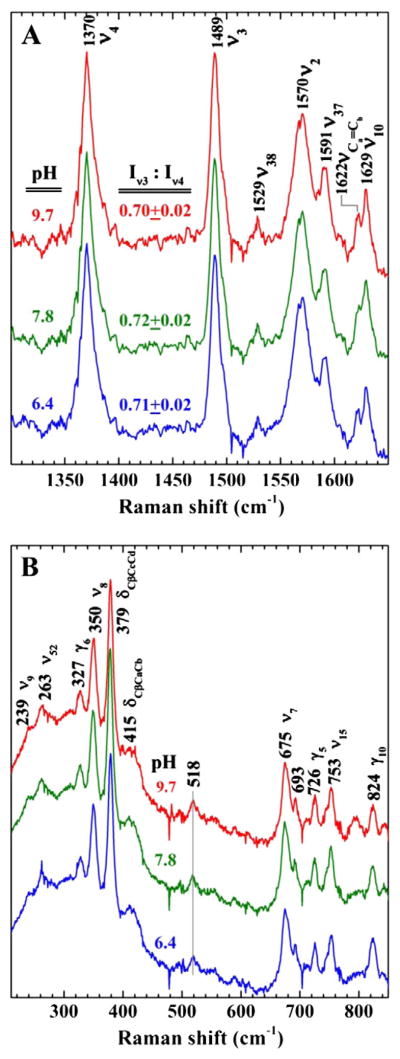
Fig. 4.

Resonance Raman spectrum of HmbR. Resonance Raman of HmbR showing the A) high frequency and B) low frequency spectra. Each panel has three spectra (bottom, middle, and top) corresponding to different buffers (MES, Tris, or CAPS) and pH conditions (6.4, 7.8, and 9.7), respectively. Samples were prepared in 0.05% Anzergent™, 300 mM NaCl, and 100 mM of the indicated buffer. Data were obtained using a 406.7 nm emission from a Kr+ laser using a power of 14 mW, a 135° backscattering geometry, and spun at 20 Hz in 5 mM NMR tubes at room temperature to avoid laser induced degradation. The laser bean was calibrated against Raman frequencies of toluene and DMF, and focused to a line on the spinning NMR tubes. The identity of certain peaks is indicated in each graph.
