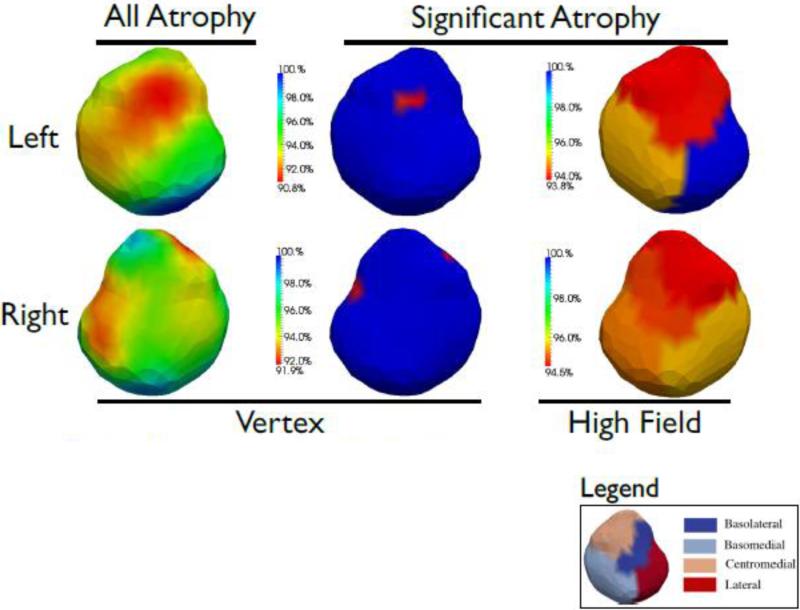
Figure. Results modeling SZ as compared to psychotic BP.
Top and bottom rows portray left and right amygdala respectively. The left column shows the vertex marker and all % atrophy, regardless of significance. Note that the relative % surface atrophy is shown, with 100% meaning no difference. The middle column shows the vertex maker with regions of statistically significant atrophy shown in red, the blue implies no statistically significant atrophy (determinant Jacobian=1). The right column shows the four high field markers, with 7T subfields transferred to the 1.5T population template. Where there is statistically significant reduction, the relative % atrophy is shown in warm hues (yellow to red), with red indicating the largest % atrophy, the blue implies no statistically significant atrophy (determinant Jacobian=1). The legend shows the segmentations of the four subregions in the left amygdala.

